Fig. 5
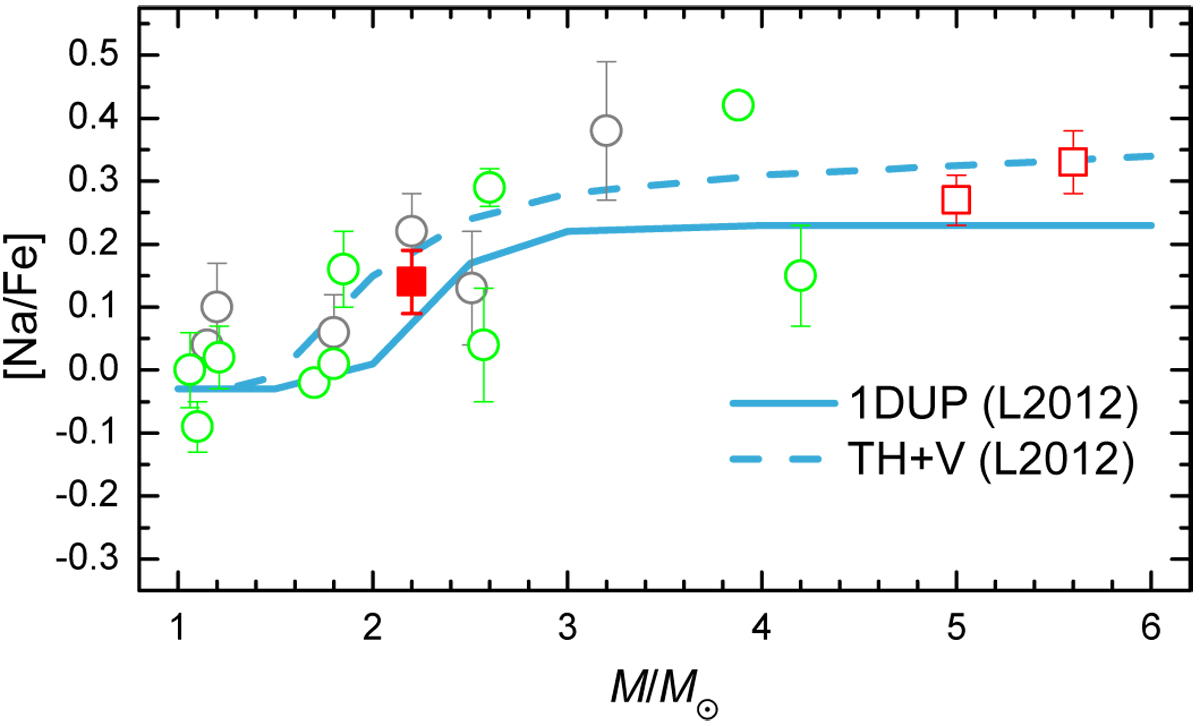
Mean [Na/Fe]NLTE abundances in open clusters compared to theoretical models by Lagarde et al. (2012). The result obtained in this study is marked with the red square. The red open squares indicate results from Drazdauskas et al. (2016b). The results from MacLean et al. (2015) are indicated as the open grey circles and from Smiljanic et al. (2016) are shown as the green open circles.
Current usage metrics show cumulative count of Article Views (full-text article views including HTML views, PDF and ePub downloads, according to the available data) and Abstracts Views on Vision4Press platform.
Data correspond to usage on the plateform after 2015. The current usage metrics is available 48-96 hours after online publication and is updated daily on week days.
Initial download of the metrics may take a while.