Free Access
Fig. 2
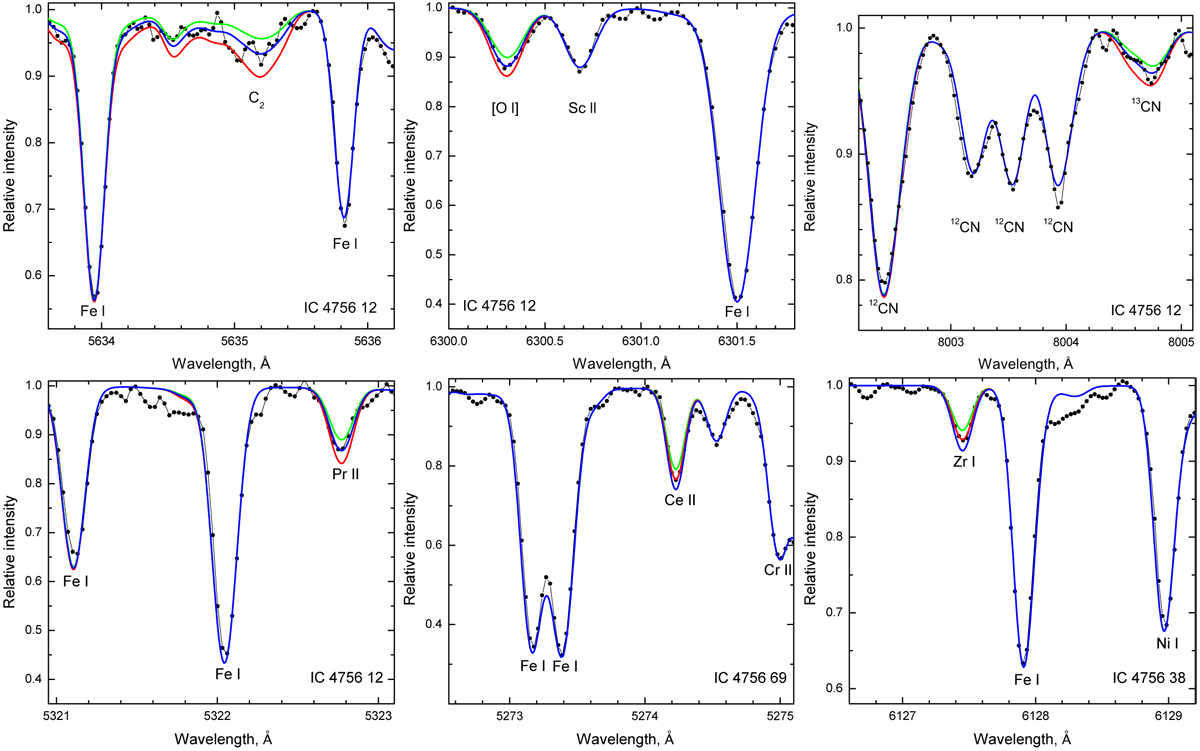
Examples of the synthetic spectrum fits to various lines for the stars IC 47561 12, IC 47563 8, and IC 4756 69. The blue and green lines represent a change in abundance by ± 0.1 dex to the corresponding elements, except in the case of 12C∕13C where the green and red lines represent ± 5.
Current usage metrics show cumulative count of Article Views (full-text article views including HTML views, PDF and ePub downloads, according to the available data) and Abstracts Views on Vision4Press platform.
Data correspond to usage on the plateform after 2015. The current usage metrics is available 48-96 hours after online publication and is updated daily on week days.
Initial download of the metrics may take a while.