Fig. 5.
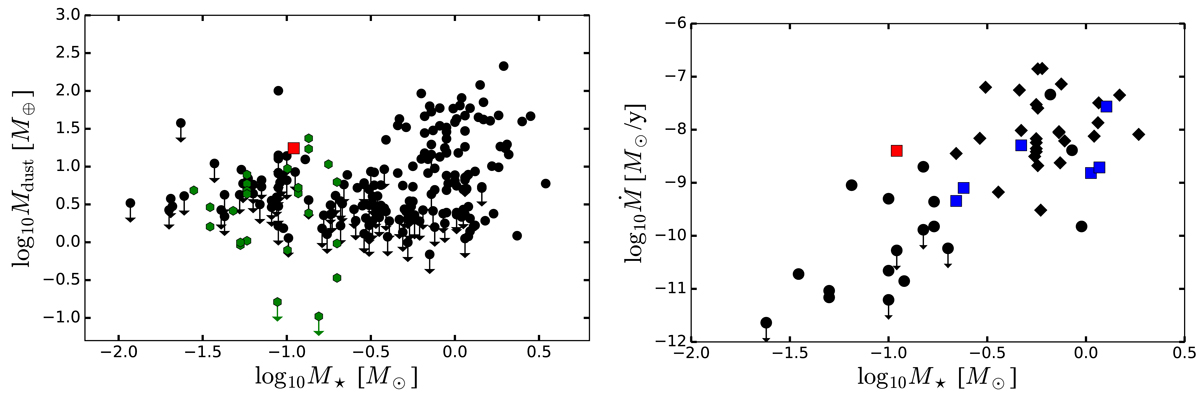
Left panel: dust mass versus stellar mass for Taurus Class II objects. Dots and upper limits from Andrews et al. (2013), assuming a dust temperature as Tdust ≈ 25 × (L⋆/L⊙)0.25 K, and the evolutionary models from Baraffe et al. (1998) to calculate the stellar mass. The hexagonal points correspond to the targets reported by Ward-Duong et al. (2018), assuming the same procedure as in Andrews et al. (2013) to calculate the dust disk mass. The position of CIDA 1 is shown by the red square. Right panel: mass accretion rate versus stellar mass for Taurus Class II objects. Dots from Herczeg & Hillenbrand (2008), diamonds from the compilation of Rigliaco et al. (2015). The location of CIDA 1 is shown by the red square. Known TDs as classified by Rigliaco et al. (2015) are identified by blue squares.
Current usage metrics show cumulative count of Article Views (full-text article views including HTML views, PDF and ePub downloads, according to the available data) and Abstracts Views on Vision4Press platform.
Data correspond to usage on the plateform after 2015. The current usage metrics is available 48-96 hours after online publication and is updated daily on week days.
Initial download of the metrics may take a while.