Fig. 4.
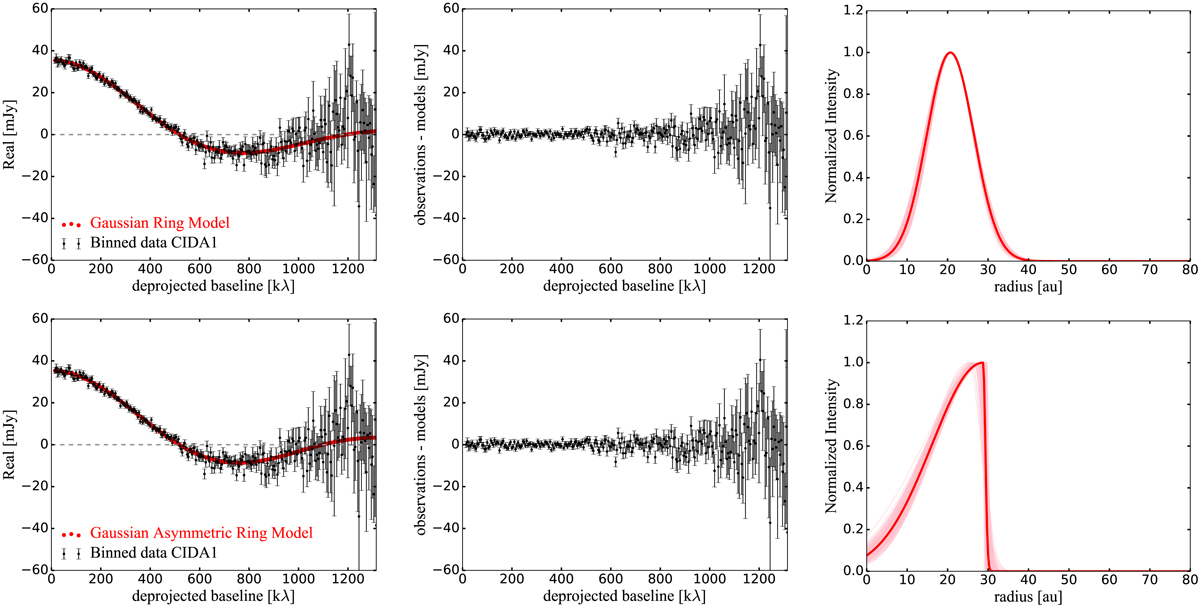
Left panel: real part of the visibilities for CIDA 1. The model with the best-fit parameters is over-plotted. Middle panel: residuals after subtracting the best-fit model from data. Right panel: best fit intensity model, which is normalized to the value at the location of peak of the ring. In addition, 200 samples from the chain are over-plotted (light pink lines). The top panels correspond to a model with a radially symmetric ring (Eq. (3)) and the bottom panels correspond to a Gaussian with different inner and outer widths with respect to the peak.
Current usage metrics show cumulative count of Article Views (full-text article views including HTML views, PDF and ePub downloads, according to the available data) and Abstracts Views on Vision4Press platform.
Data correspond to usage on the plateform after 2015. The current usage metrics is available 48-96 hours after online publication and is updated daily on week days.
Initial download of the metrics may take a while.