Fig. 5
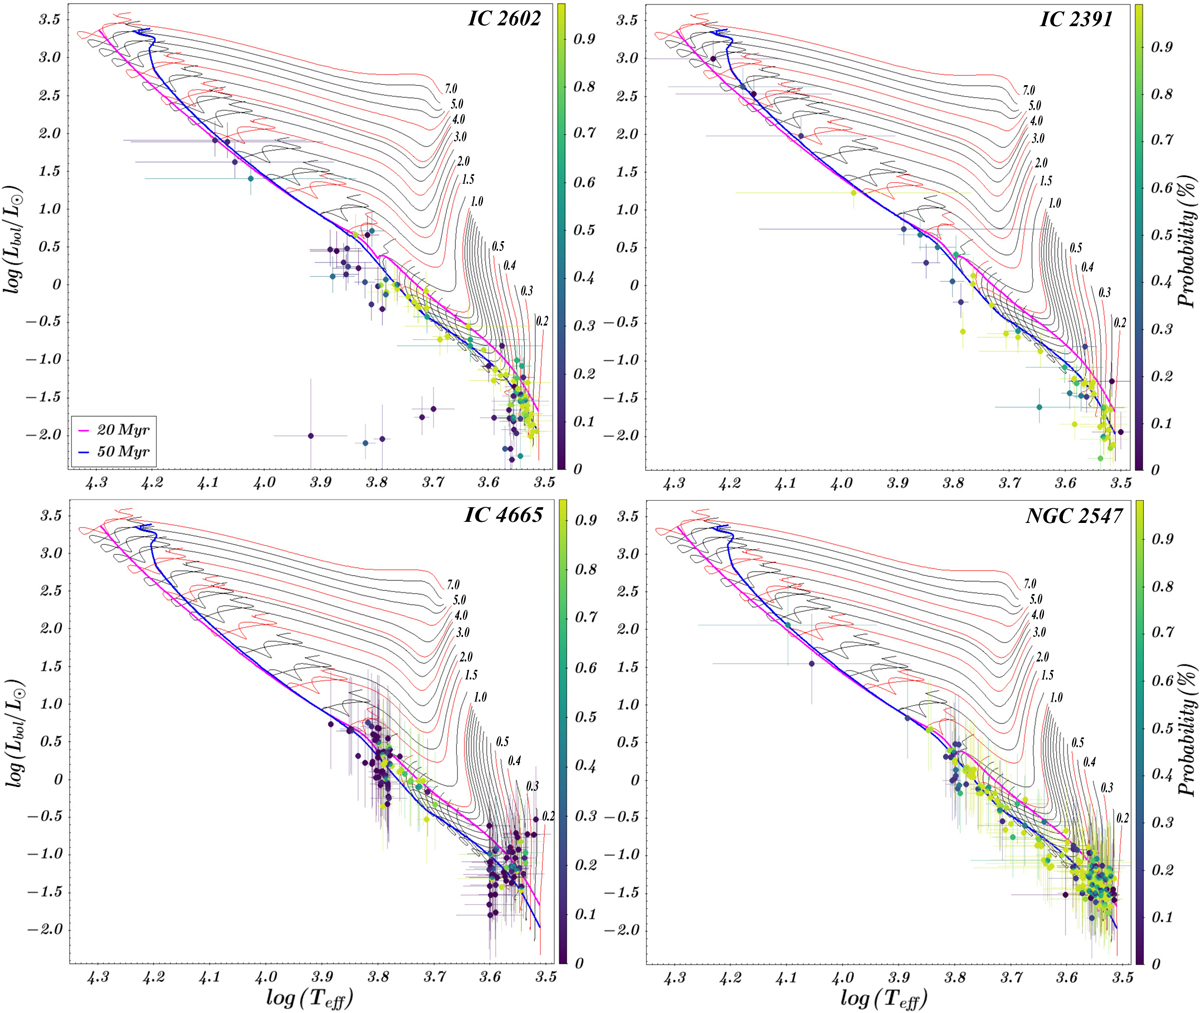
Hertzsprung–Russell diagram of the sample of clusters. The colored filled dots represent GES targets retained after the procedure of cleaning from the obvious contaminants. The spectroscopic candidates color-coded depending on the probability of belonging to the cluster (scale at right). The magenta and blue lines are the isochrones at 20 and 50 Myr, respectively, and the black and red lines are the PMS evolutionary tracks (Tognelli et al. 2011).
Current usage metrics show cumulative count of Article Views (full-text article views including HTML views, PDF and ePub downloads, according to the available data) and Abstracts Views on Vision4Press platform.
Data correspond to usage on the plateform after 2015. The current usage metrics is available 48-96 hours after online publication and is updated daily on week days.
Initial download of the metrics may take a while.