Fig. 6.
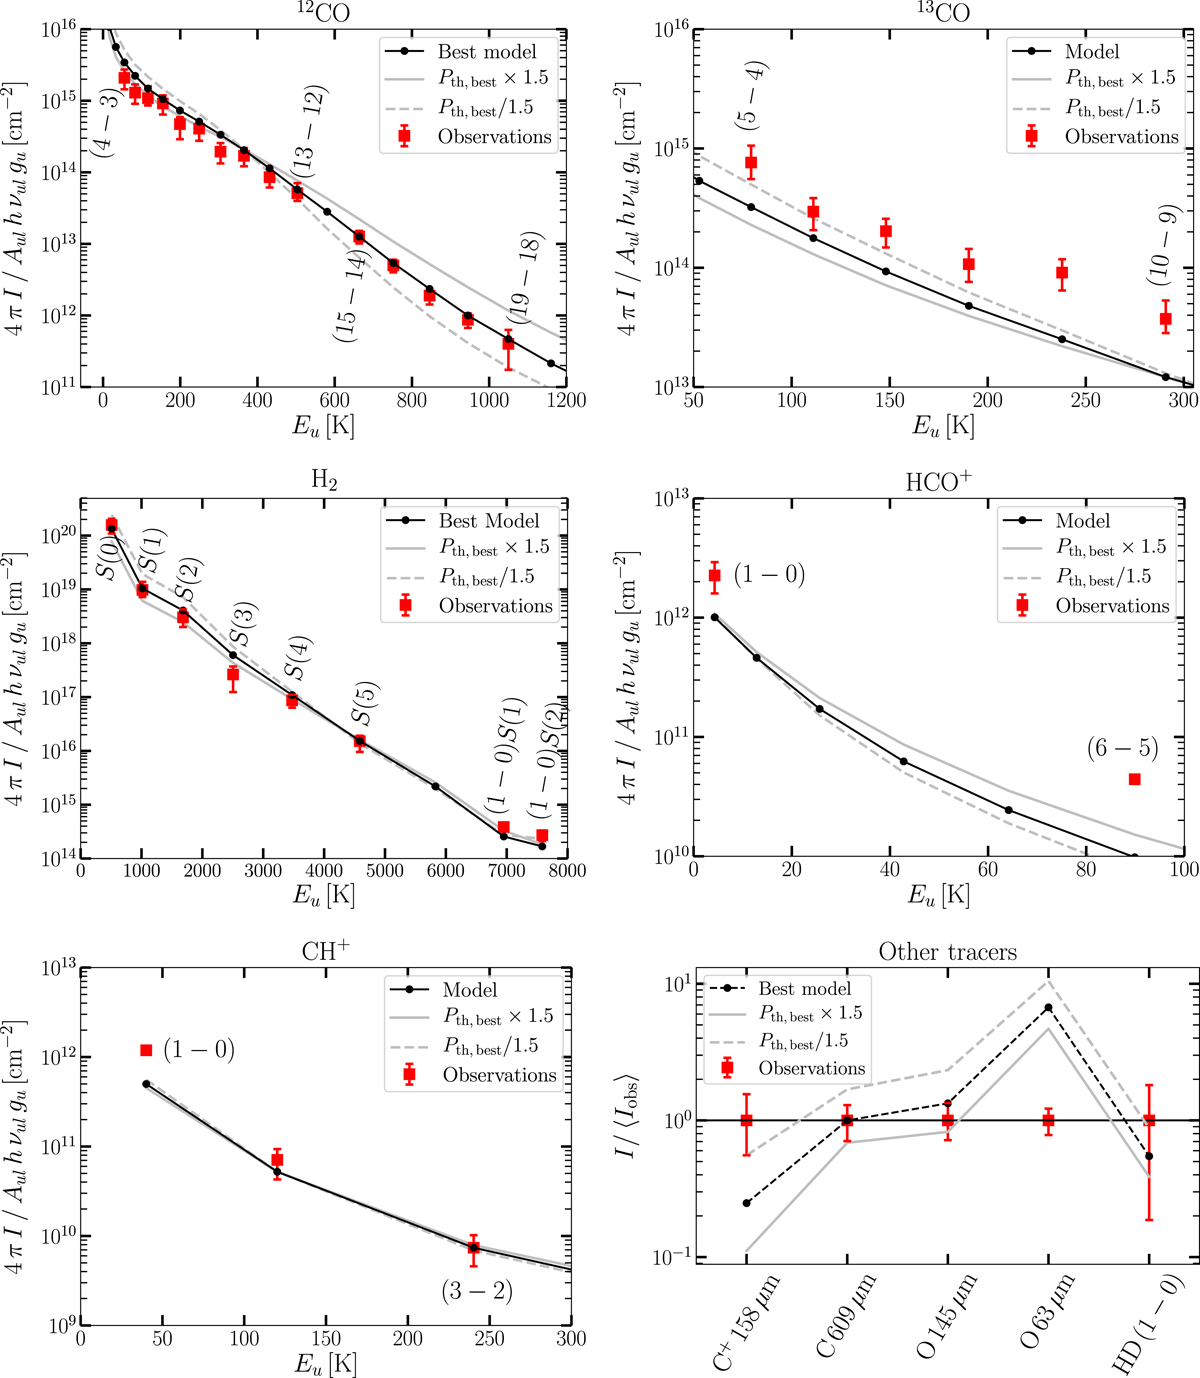
Excitation diagram of the different tracers observed in NGC 7023 after dilution correction (red squares) and the best fit model (black, Pth = 108 K cm−3, ![]() = 10, global scaling factor = 0.7). The best model has been chosen to optimise the fitting of the 12CO (high-J lines), H2 and CH+ lines only. In the last panel, the intensity values are normalised by the mean observed value for each line. The grey lines show the obtained variability when the thermal pressure is divided (dashed lines) or multiplied (plain lines) by a factor of 1.5. The best value for the scaling factor was found to be 1.2 for the model at Pth/1.5 and 0.47 for the model at Pth × 1.5.
= 10, global scaling factor = 0.7). The best model has been chosen to optimise the fitting of the 12CO (high-J lines), H2 and CH+ lines only. In the last panel, the intensity values are normalised by the mean observed value for each line. The grey lines show the obtained variability when the thermal pressure is divided (dashed lines) or multiplied (plain lines) by a factor of 1.5. The best value for the scaling factor was found to be 1.2 for the model at Pth/1.5 and 0.47 for the model at Pth × 1.5.
Current usage metrics show cumulative count of Article Views (full-text article views including HTML views, PDF and ePub downloads, according to the available data) and Abstracts Views on Vision4Press platform.
Data correspond to usage on the plateform after 2015. The current usage metrics is available 48-96 hours after online publication and is updated daily on week days.
Initial download of the metrics may take a while.