Fig. 4.
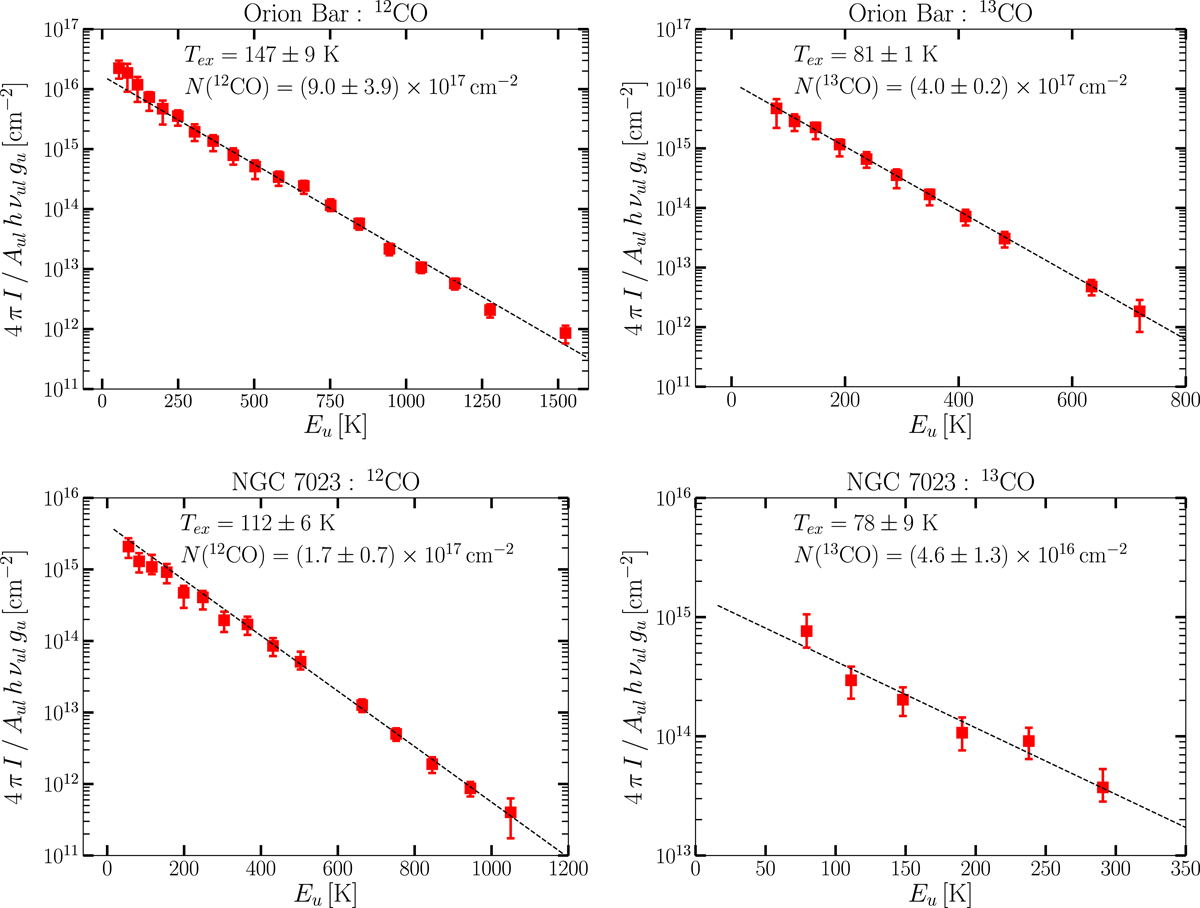
Rotational diagram of 12CO (left) and 13CO (right) lines observed in the Orion Bar (top panel) and NGC 7023 (bottom panel) PDRs. For 12CO, the excitation temperature and total column density are computed in the range J up = [15, 23] (Orion Bar), and J up = [15, 19] (NGC 7023). For 13CO, the lines used were J up = [5, 16] (Orion Bar), and J up = [5, 10] (NGC 7023).
Current usage metrics show cumulative count of Article Views (full-text article views including HTML views, PDF and ePub downloads, according to the available data) and Abstracts Views on Vision4Press platform.
Data correspond to usage on the plateform after 2015. The current usage metrics is available 48-96 hours after online publication and is updated daily on week days.
Initial download of the metrics may take a while.