Fig. 1.
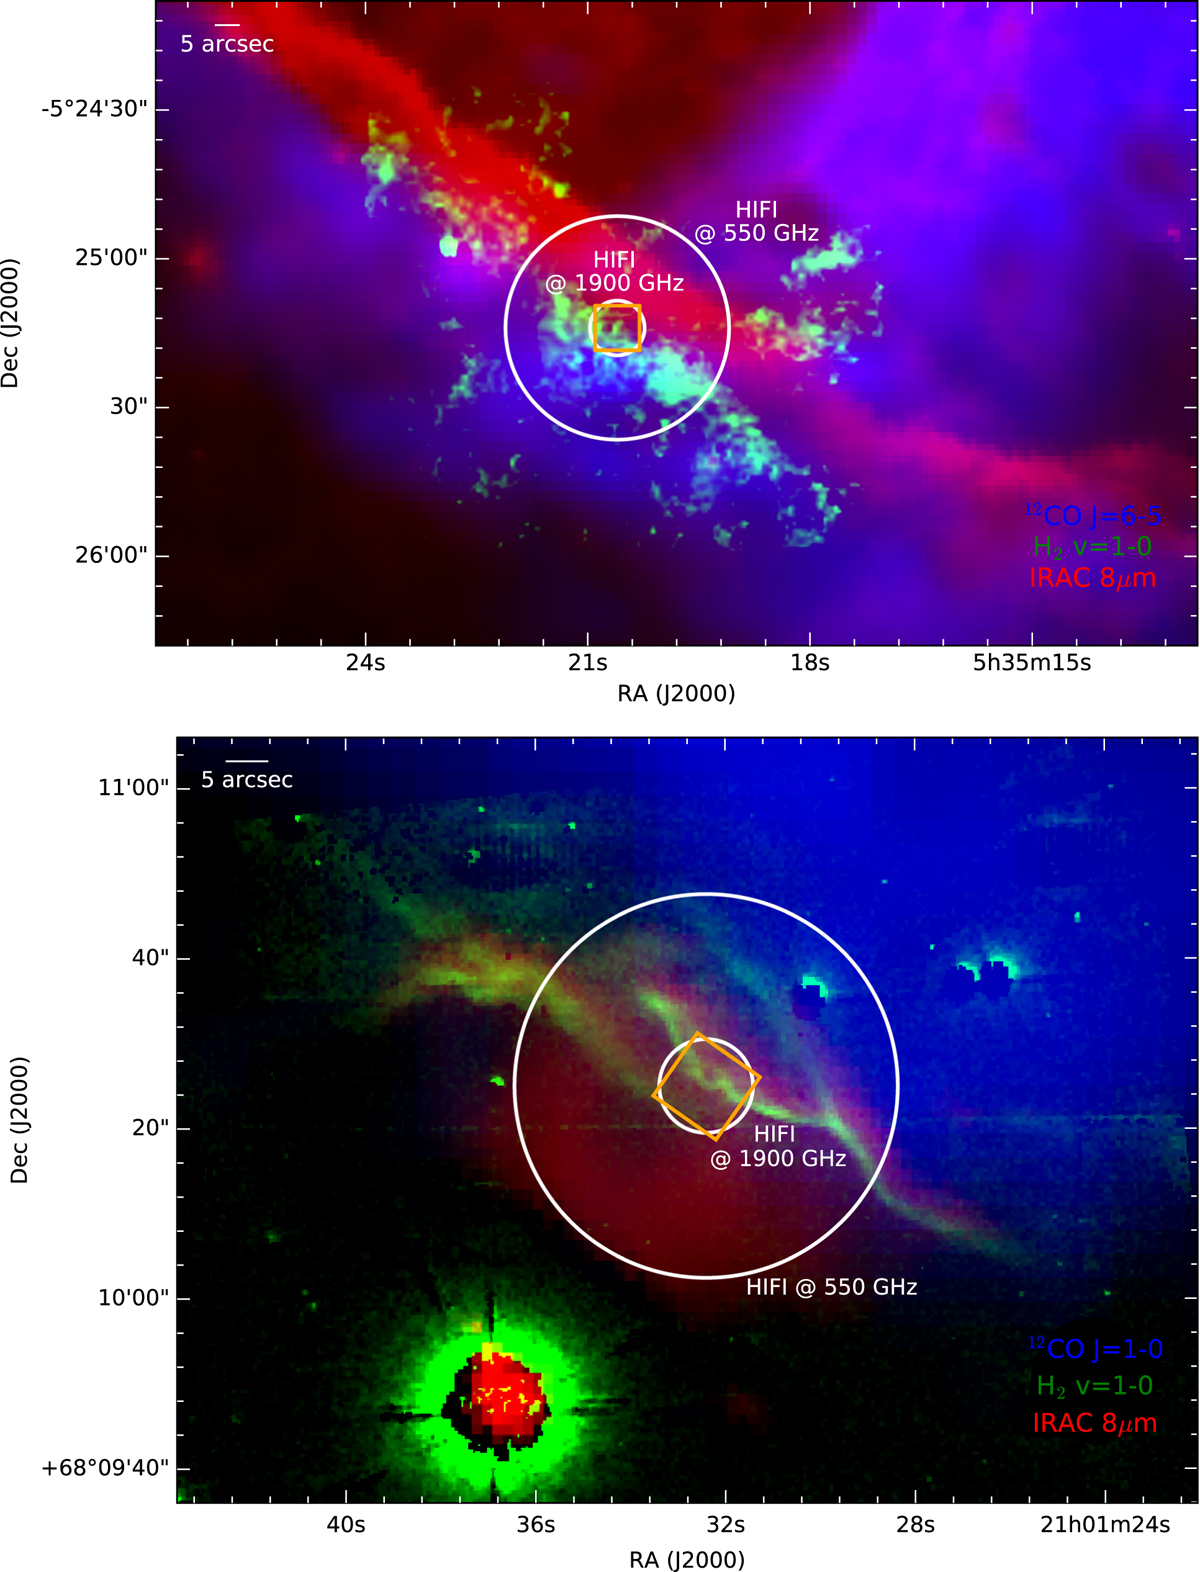
Composite images of the Orion Bar (top panel) and NGC 7023 (bottom panel). Red indicates the 8 μm emission observed with Spitzer. Green shows the vibrationally excited emission of H2 from Lemaire et al. (1996) and van der Werf et al. (1996) for NGC 7023 and Orion Bar, respectively. Blue shows the 12CO emission, J = 6 − 5 for the Orion Bar (Lis & Schilke 2003) and J = 1−0 for NGC 7023 (Gerin et al. 1998). The circles represent the HPBW of Herschel at 550 GHz and 1900 GHz. The square indicates the position of the central spaxel of the PACS observations.
Current usage metrics show cumulative count of Article Views (full-text article views including HTML views, PDF and ePub downloads, according to the available data) and Abstracts Views on Vision4Press platform.
Data correspond to usage on the plateform after 2015. The current usage metrics is available 48-96 hours after online publication and is updated daily on week days.
Initial download of the metrics may take a while.