Fig. 9
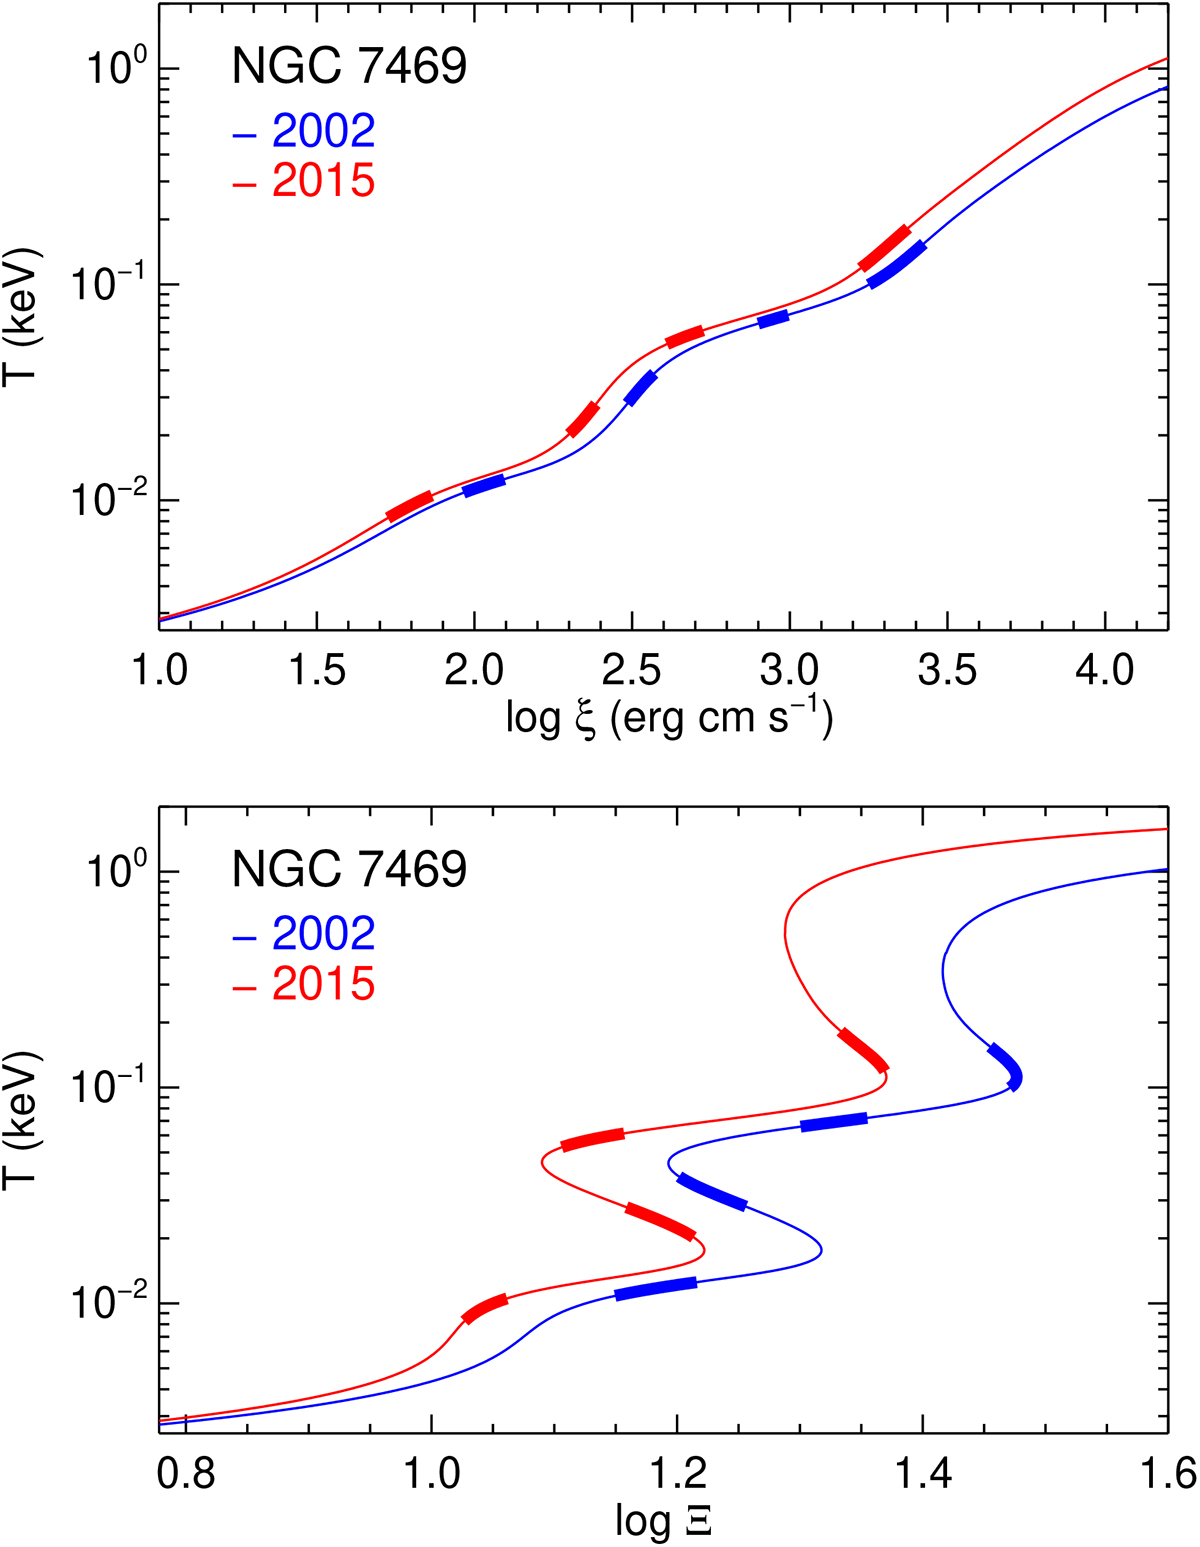
Thermal stability curves of photoionised gas in NGC 7469, showing the gas electron temperature T plotted as a function of the ionisation parameters ξ (top panel), and the pressure-form of the ionisation parameter Ξ (bottom panel). The curves are calculated for the 2002 and 2015 SEDs (Fig. 2, bottom panel). The thick stripes on each curve indicate the position of the derived wind absorption components (Comps. A to D) from the best-fit model to the 2002 and 2015 HETGS spectra. For identification, Comp. A has the lowest T, and Comp. D the highest.
Current usage metrics show cumulative count of Article Views (full-text article views including HTML views, PDF and ePub downloads, according to the available data) and Abstracts Views on Vision4Press platform.
Data correspond to usage on the plateform after 2015. The current usage metrics is available 48-96 hours after online publication and is updated daily on week days.
Initial download of the metrics may take a while.