Fig. 2
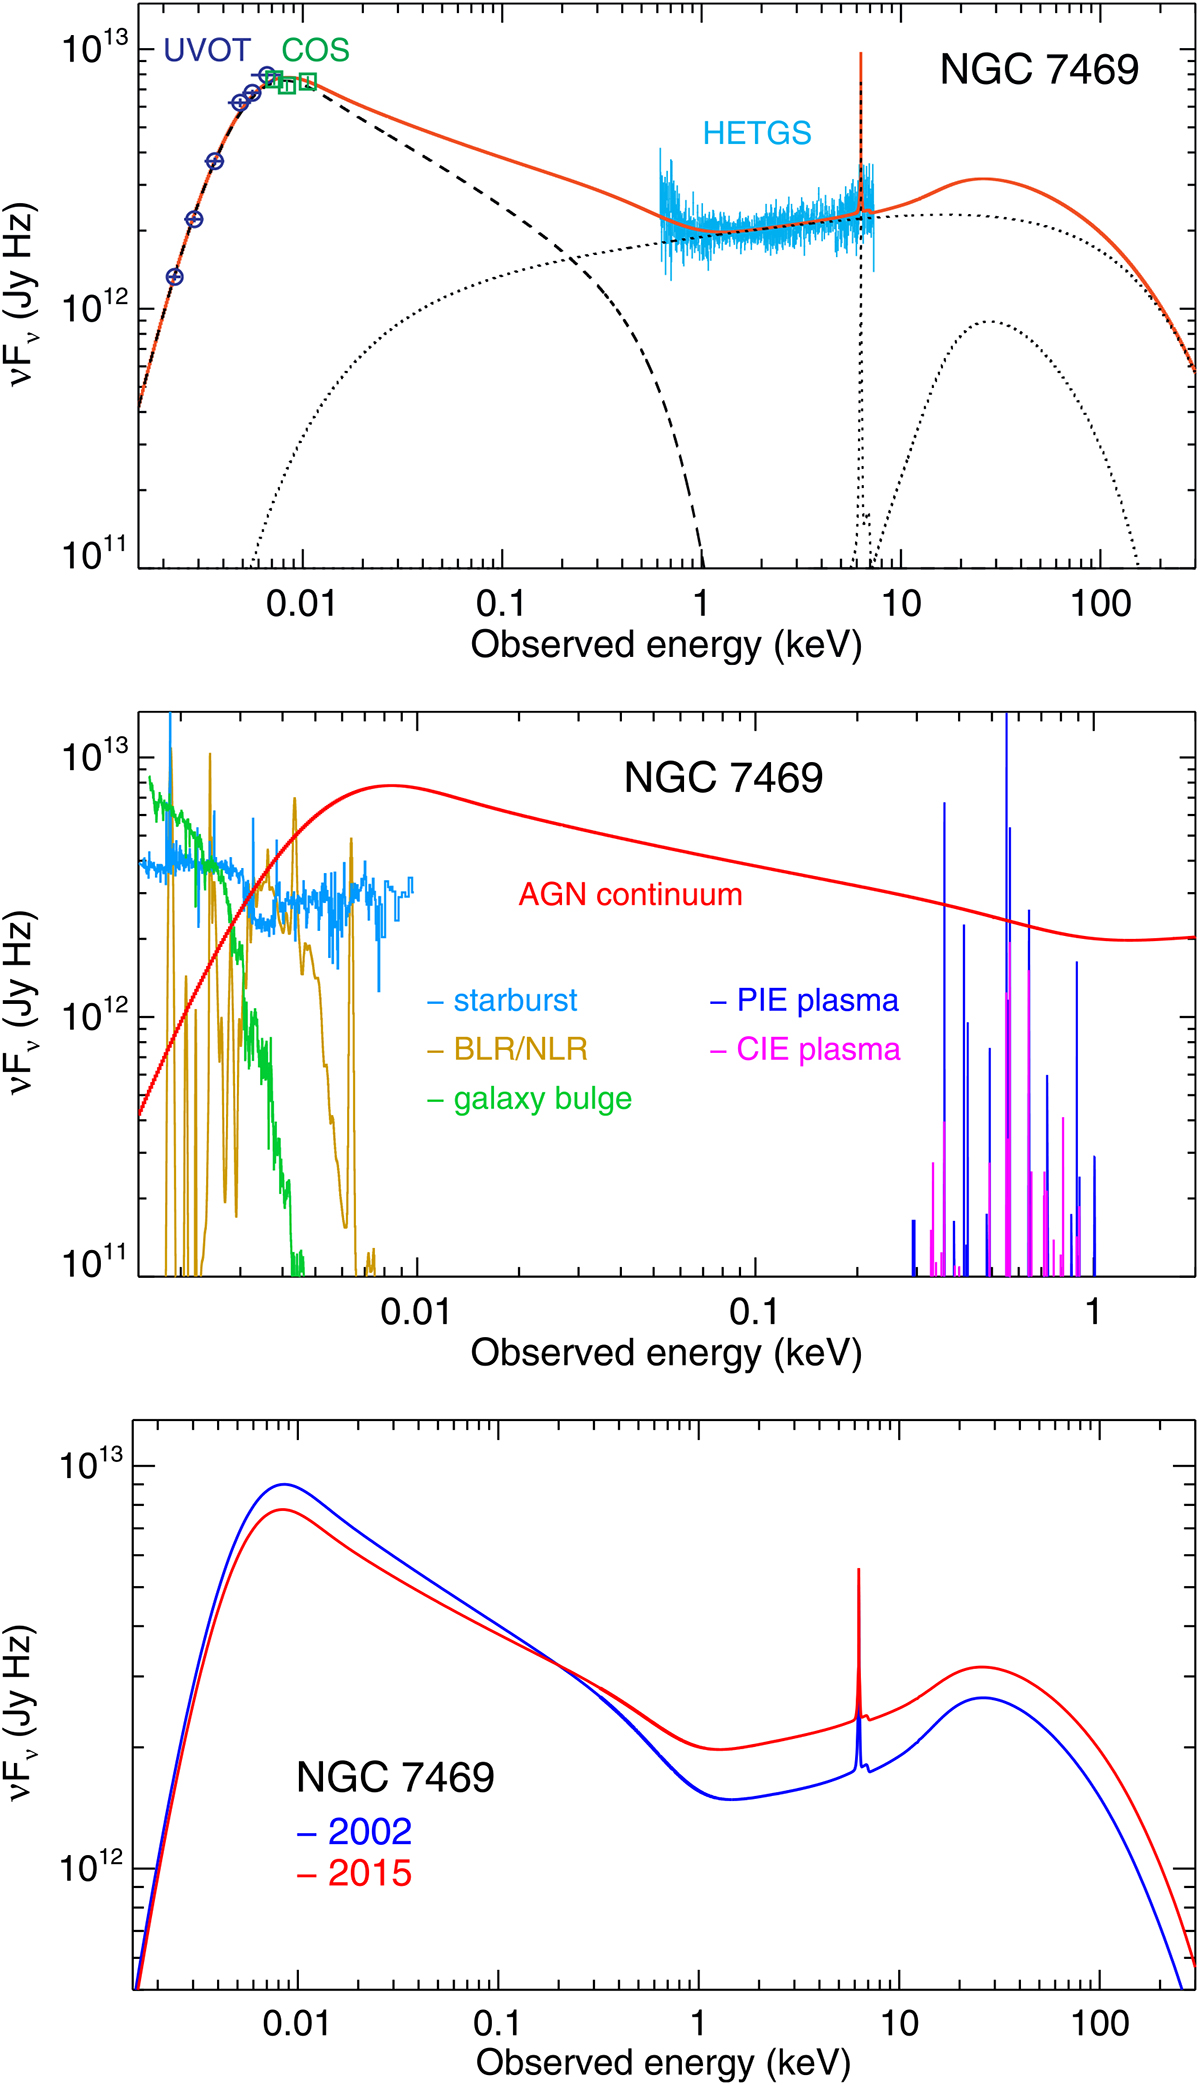
Spectral energy distributions of NGC 7469 from optical to hard X-rays. Top panel: the best-fit continuum model, derived in Sect. 3, fitted to the 2015 Chandra HETGS, HST COS and Swift UVOT data. The displayed data are corrected for the emission and absorption effects described in Sect. 3, required for determining the underlying AGN continuum. The individual components of the continuum model are displayed: a warm Comptonisation component (comt), shown in dashed black line, a power-law (pow) and a reflection (refl) component, shown in dotted black lines. Middle panel: the 2015 AGN continuum model (shown in red), and the individual optical/UV and soft X-ray emission components that were modelled for uncovering the underlying continuum. Bottom panel: comparison of the SED continuum models for the 2002 and 2015 epochs, which were used in our photoionisation modelling. The 1–1000 Ryd luminosity is 1.37 × 1044 erg s−1 in 2002 and 1.42 × 1044 erg s−1 in 2015. The bolometric luminosity is 3.4 × 1044 erg s−1 in 2002 and 3.8 × 1044 erg s−1 in 2015.
Current usage metrics show cumulative count of Article Views (full-text article views including HTML views, PDF and ePub downloads, according to the available data) and Abstracts Views on Vision4Press platform.
Data correspond to usage on the plateform after 2015. The current usage metrics is available 48-96 hours after online publication and is updated daily on week days.
Initial download of the metrics may take a while.