Fig. 1
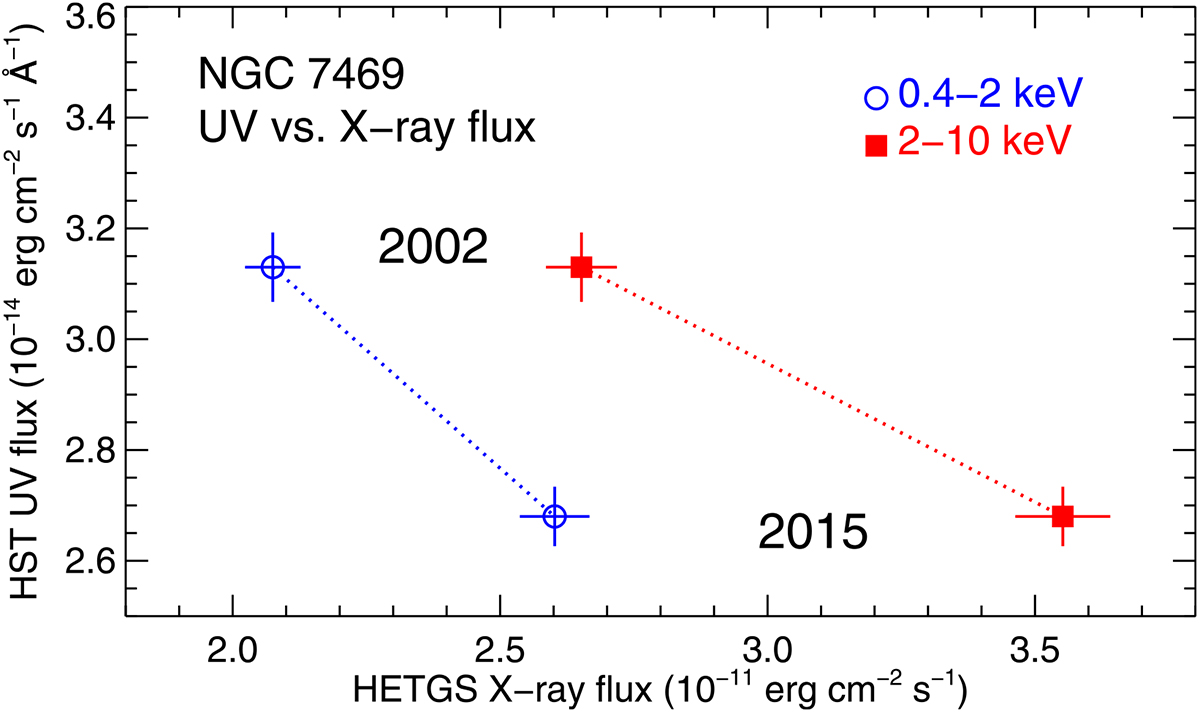
Comparison of the UV (HST) and X-ray (Chandra) fluxes of NGC 7469 in the 2002 and 2015 epochs. The HST flux at 1170 Å is plotted vs. the HETGS flux over 0.4–2 keV (shown in blue) and 2–10 keV (shown in red). The HST data are from STIS (2002) and COS (2015) observations. The displayed fluxes are the observed fluxes without any modification for reddening or absorption.
Current usage metrics show cumulative count of Article Views (full-text article views including HTML views, PDF and ePub downloads, according to the available data) and Abstracts Views on Vision4Press platform.
Data correspond to usage on the plateform after 2015. The current usage metrics is available 48-96 hours after online publication and is updated daily on week days.
Initial download of the metrics may take a while.