Fig. 7
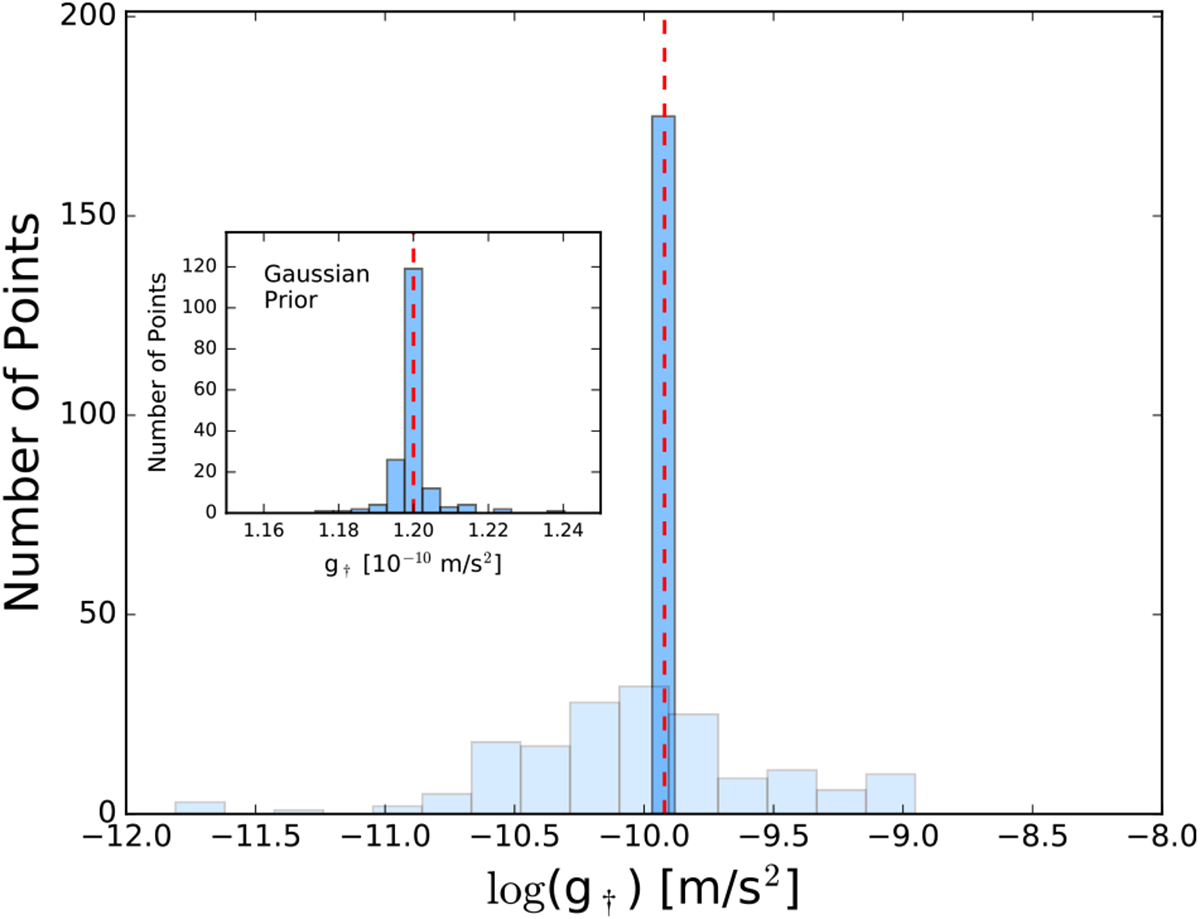
Distribution of optimal g† imposing a flat (light blue) and Gaussian (dark blue) prior. The red dashed line marks our fiducial value 1.2 × 10⁻¹⁰ m s−2. The inset shows the Gaussian prior alone, zoomed in and switched to a linear scale to resolve the distribution. Note the vast difference in scales: the flat prior results in a broad range of g† (although with no improvement in χ2, as seen in Fig. 6), while the Gaussian prior effectively returns a constant g†.
Current usage metrics show cumulative count of Article Views (full-text article views including HTML views, PDF and ePub downloads, according to the available data) and Abstracts Views on Vision4Press platform.
Data correspond to usage on the plateform after 2015. The current usage metrics is available 48-96 hours after online publication and is updated daily on week days.
Initial download of the metrics may take a while.