| Issue |
A&A
Volume 615, July 2018
|
|
|---|---|---|
| Article Number | A115 | |
| Number of page(s) | 8 | |
| Section | Catalogs and data | |
| DOI | https://doi.org/10.1051/0004-6361/201732545 | |
| Published online | 24 July 2018 | |
Hot star extension to the Hubble Space Telescope stellar spectral library★
Department of Physics and Astronomy, Washington State University, Pullman, WA, USA
e-mail: This email address is being protected from spambots. You need JavaScript enabled to view it.
; This email address is being protected from spambots. You need JavaScript enabled to view it.
Received:
23
December
2017
Accepted:
21
March
2018
Abstract
Context. Libraries of stellar spectra find many uses in astrophysics, from photometric calibration to stellar population synthesis.
Aims. We present low resolution spectra of 40 stars from 0.2 μm (ultraviolet) to 1.0 μm (near infrared) with excellent fluxing. The stars include normal O-type stars, helium-burning stars, and post-asymptotic giant branch (PAGB) stars.
Methods. Spectra were obtained with the Space Telescope Imaging Spectrograph (STIS) installed in the Hubble Space Telescope (HST) using three low resolution gratings, G230LB, G430L, and G750L. Cosmic ray hits and fringing in the red were corrected. A correction for scattered light was applied, significant only for our coolest stars. Cross-correlation was used to bring the spectra to a common, final, zero velocity wavelength scale. Finally, synthetic stellar spectra were used to estimate line of sight dust extinction to each star, and a five-parameter dust extinction model was fit, or a one-parameter fit in the case of low extinction.
Results. These spectra dovetail with the similar Next Generation Stellar Library (NGSL) spectra, extending the NGSL’s coverage of stellar parameters, and extending to helium burning stars and stars that do not fuse.
Conclusions. The fitted dust extinction model showed considerable variation from star to star, indicating variations in dust properties for different lines of sight. Interstellar absorption lines are present in most stars, notably Mg II.
Key words: atlases / stars: horizontal-branch / stars: AGB and post-AGB / stars: early-type / dust, extinction / Hertzsprung-Russell and C-M diagrams
The reduced spectra are available at the CDS via anonymous ftp to cdsarc.u-strasbg.fr (130.79.128.5) or via http://cdsarc.u-strasbg.fr/viz-bin/qcat?J/A+A/615/A115. It is also available at https://archive.stsci.edu/prepds/hotstarlib/.
© ESO 2018
1 Introduction
Stellar libraries are collections of stellar spectra. These libraries find a wide variety of applications. They are used in education (e.g., Project CLEA and VIREO Marschall et al. 2013), as secondary flux standards (Prugniel & Soubiran 2001), as checks for synthetic spectral calculations (Allende Prieto 2011), as grid markers for finding the atmospheric parameters for stars (Wu et al. 2011), as templates for synthetic photometry (Bessell & Murphy 2012), in exoplanet studies (Mann et al. 2015), and as ingredients in stellar population models for integrated light (Bruzual 1983). Stellar libraries can be synthetic or observational and can differ widely in the quality of spectrophotometric fluxing, spectral resolution, and wavelength coverage. Empirical spectral libraries that incorporate stars that cover a range of metal abundance include ELODIE (Prugniel & Soubiran 2001; Prugniel et al. 2007), CFLIB (Valdes et al. 2004), MILES (Sánchez-Blázquez et al. 2006), UVES-POP (Bagnulo et al. 2003), MaStar (Yan & the MaStar Team 2017), XSL (Chen et al. 2014), and IRTF (Villaume et al. 2017).
These libraries do not cover the ultraviolet (UV), which is of keen interest especially for stellar population analysis of distant galaxies. Line lists in the UV are less mature than in the optical, and hence synthetic spectra do a worse job in predicting the flux there (Edvardsson 2008). Wu et al. (1983) and Fanelli et al. (1992) presented a UV spectral library using International Ultraviolet Explorer (IUE) data at a resolution of 7 Å and a sample of 218 stars at mostly solar abundance.
Using the Space Telescope Imaging Spectrograph (STIS) aboard the Hubble Space Telescope (HST), the Next Generation Spectral Library (NGSL) vastly improves spectral resolution, sample size, and heavy element abundance coverage. The NGSL spectra were reduced by Heap (2009) and made available on MAST1. At the beginning of Cycle 22 the NGSL consisted of 374 stars with good coverage of temperature and gravity and modest coverage of metallicity (Koleva & Vazdekis 2012; Heap & Lindler 2010). More stars have been observed since. The final spectral coverage is from ~0.2 to ~1.0 μm with a resolving power of R ~1000 and roughly 3% fluxing accuracy (Heap & Lindler 2009).
The NGSL, however, is deficient in hot stars, as illustrated in Fig. 1. Normal O stars are the dominant component of the integrated light of star forming galaxies. The NGSL also lacks late-stage stellar types. Post-asymptotic giant branch (PAGB) and extreme horizontal branch (EHB) stars provide most of the UV flux for old quiescent stellar populations (Dorman et al. 1995). HST time was requested to observe these stellar groups, with the intent to add the reduced spectra to the NGSL, broadening its scientific applicability.
The observations and data reduction, including correction for line of sight dust extinction, are described in Sect. 2. The results for 40 (of a total of 70 proposed) stars are given in Sect. 3. Conclusions and future work appearin Sect. 4.
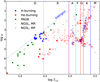 |
Fig. 1 NGSLstars and our sample in a log Teff, log g diagram.NGSL stars (Koleva & Vazdekis 2012) are separated by abundance, [Fe/H] > −1 (red plus) or [Fe/H] ≤−1 (blue plus). Hot star library candidate stars are marked with circles. The circles are filled for stars that were observed and included in this paper. All O star candidates (blue) were observed, but not all PAGB stars (green) or He-burning stars (red). To guide the eye, an approximate Eddington stability line is drawn, and approximate spectral type boundaries. |
2 Observations
Stars were selected from the literature to cover a range of temperatures in each category with a preference for brighter stars to decrease exposure times. Vacca et al. (1996); Ryans et al. (2003); Mendez et al. (1988); Heber (1987); Altmann & de Boer (2000); Lamontagne et al. (1985); Pancino et al. (2015) were especially helpful sources. In addition, PAGB sequences in temperaturewere constructed for both H-rich and H-deficient types (Werner et al. 2003). SIMBAD (Wenger et al. 2000) was used to obtain coordinates and proper motions.
The HST/STIS observations were carried out in “snapshot mode” (SNAP). In this mode, targets are chosen by the HST scheduling program from a list provided by the observer, in our case, 70 objects. Over time, targets are selected from the list and observed, but not all targets in the list. After being scheduled, the telescope points to the target star for somewhat less than half an orbit. After target acquisition, spectra are taken through three low-resolution gratings (G230LB, G430L, and G750L) whose spectral coverage overlaps at 2990–3060 Å and 4400–5650 Å. The three gratings have λ∕Δ λ = 1800, 1200, and 1000, respectively. Unlike NGSL, we specified a 0′′.5 slit instead of a 0′′.2 slit in order to avoid a wavelength-dependent correction that varies as a function of offset of the target from the slit center (Lindler & Heap 2008). Exposures are cosmic-ray split, and a fringe flat taken for the G750L grating after each observation.
All science images were cleaned for cosmic rays with a pass through L.A.Cosmic (van Dokkum 2001). Occasionally, L.A.Cosmic was destructive to our data. In that case, we relaxed parameters and iterated. In all cases, the L.A.Cosmic pass was followed by a second pass through the STSDAS task ocrreject.
The STIS CCD suffers thin film interference fringing at wavelengths redward of 7000 Å. The G750L fringe flats of all visits were averaged. That average was used with STSDAS tasks normspflat, mkfringeflat, and defringe to correct for the fringing (Bostroem & Proffitt 2011). These tasks shifted the average fringe flat in wavelength and rescaled the correction, case by case.
2.1 Scattered light in G230LB
Grating-internal scattered light is an issue for G230LB. It is obvious in very cool stars. Following Lindler & Heap (2008), we model the scattered light after extracting spectra from the CCD frame with a ramp plus a pedestal:
 (1)
(1)
where the scattered light S L is in counts per second per pixel in the extracted net spectrum, Slope is the slope of the scattered light profile across the detector, x is the pixel number, and c0, the amount of scattered light, is given by:
 (2)
(2)
where C(λ) is the scattered light in counts/second and n is a selectable exponent. Using n = 3, Lindler & Heap (2008) obtained Slope = 0.0024 and A = 5523 by straight line fitting.
The (red) scattered light calculation required integration over the whole spectrum, not just the UV portion. We used the redder spectra to provide these count rates, but first we converted G430L and G750L count rates to G230LB count rates using prelaunch throughput estimates. After assembling a full pseudo-G230LB spectrum spanning the 2000 to 10 000 Å range, we integrated the count rate divided by the wavelength cubed, then multiplied by 5523 to get c0. We subtracted Eq. (1) from the G230LB net spectrum. Thus corrected, the G230LB spectrum was multiplied by the post-launch sensitivity curve to obtain a final spectrophotometric flux.
2.2 Wavelength calibration
No wavelength calibration exposures were obtained during observations in order to save time on spacecraft overhead. Wavelength jitter is introduced by (1) the wheel that carries the gratings (Mode Selection Mechanism) (Biretta et al. 2015), (2) the relative radial velocity of the star and spacecraft, and (3) pointing error along the dispersion axis. Each exposure was cross-correlated with template stars to shift them to a zero velocity. Templates were drawn from banks of synthetic stellar spectra and the Calspec database (Bohlin et al. 2001), with considerable cross-checking to make sure all templates had reliable wavelength scales. Wavelengths are in vacuum.
2.3 Dust extinction correction
We adopt a five parameter model (Fitzpatrick & Massa 1986, 1990) to describe the dust extinction. The model incorporates a spectroscopic feature at  m−1 (λ0 ≈ 2175 Å) dubbed the extinction bump. The UV portion of the extinction curve consists of a linear “background” term and a Lorentzian-like “Drude” profile for the bump:
 (3)
(3)
where x is the inverse of the wavelength in μm−1 and the extinction k is in magnitudes. The parameters γ, x0 , and c3 are bump wavelength width, center wavelength, and amplitude, respectively. The “Drude” profile is given by:
 (4)
(4)
The parameters c1 and c2 follow the prescriptions c2 = −0.824 + 4.717∕R and c1 = 2.030–3.007c2, with c3 left as a free parameter. When R is allowed to vary, and for λ > 2700Å (1/λ < 3.7 μm−1), the optical/IR extinction curve is constructed as a cubic spline interpolation between a set of anchor points, following Fitzpatrick (1999). For stars with low extinction, we held all parameters constant except AV (see Appendix B).
To estimate the dust extinction, dust-free templates were needed. We generated synthetic templates using either TLUSTY (Hubeny & Lanz 1995) or ATLAS/SYNTHE (Kurucz 1993) (and, often, both), allowing modest temperature changes when it was clear that different templates made for better consistency between dereddened star and template. Both programs produced very similar continua for the same set of atmospheric parameters. Exact matches were not attempted because our goal was limited to fitting dust extinction parameters.
For each star/template pair, the spectra were filtered and smoothed with cubic splines and divided to obtain an empirical extinction curve. The empirical curve was then fit with the model described above. Typically, five parameters, Av (absorption in magnitudes in the V band), R (ratio of total to selective extinction for diffuse interstellar medium), x0, γ, and c3 were fit. For cases of low extinction (AV < 0.2 mag), AV alone was fit. The RMS value was calculated to obtain a rough goodness of fit, but most of the work of retrying templates and tweaking smoothing parameters was done judiciously by eye.
3 Results and discussion
Our main result is to present spectra of 40 stars. The SNAP program is still active at low priority, so a few more stars may enter the library in the future. As best as can be contrived, the spectra are free of cosmic rays, red fringing in the G750L, and scattered light in the case of our coolest stars. Cross-correlation was used to bring the spectra to a zero velocity wavelength scale. Finally, a five-parameter dust extinction model, or one-parameter in the case of low-extinction stars, was fit using synthetic spectra as zero-extinction templates.
Three examples are illustrated in Fig. 2, and all the stars are plotted in Appendix A. The spectra are available online2.
After the observations were reduced, we discovered a duplication. Star 3, originally filed under the name HD 26847, is the same as star18, NGC 1535. They arrived in the target list via different literature paths, with temperatures 12 000 K apart. Despite this, their separately-derived extinctions are only 0.02 mag apart, and we used this result to gauge uncertainties arising from an uncertain extinction law.
In the process of fitting extinction curves with synthetic templates, the central star in NGC 2392 (object 21 in our list) was difficultto match. We computed He-rich synthetic spectra using SYNTHE. The match improved, but was not good near H continuum breaks. This template problem may introduce a few hundredths magnitude error in AV.
A third of the PAGB stars show emission lines. These objects are: PN A66 78 (6), LS III +52 24 (13), LS IV −12 111 (14), IC 2448 (19), NGC 2392 (21), and Hen 2-182 (22).
A pair of resonance Mg II absorptions at 2795.5 Å (k) and 2802.7 Å (h) can have contributions from the stellar atmosphere and also the interstellar medium. In stars with chromospheres, it may also have an emission component (Gurzadian et al. 1990). As a guide to excitation, Mg II λλ4481 is weak in early O types, but grows prominent in middle B types (Gray & Corbally 2009). Thus, in most of this library, Mg II absorptions are interstellar (or circumstellar for PAGB stars), not photospheric. The only unambiguously photospheric occurrences of photospheric Mg II in the UV resonance doublet are for cool PAGB star (13) LS III +52 24, helium-burning stars (43) PHL 382, (47) SB-707, and (50) HD 205805, and RR Lyrae variable stars (58) DR And and (66) RX Cet.
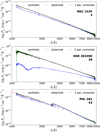 |
Fig. 2 Example spectra. Spectra as observed (blue) and as extinction corrected (black) with errors (flanking green curves). The no-dust template synthetic spectrum (magenta) overlaps. We show PAGB star NGC 1535 (top), O star HDE 303308 (middle), and horizontal branch star PHL 382 (bottom). Internal program identifications appear below the object name. |
4 Conclusions
We present low resolution spectra from 0.2 to 1.0 μm, fully fluxed and wavelength calibrated, observed with STIS on HST and extending into the near UV. This newly-observed collection of spectra adds diagnostic value to the NGSL by exploring O stars, helium burning stars, and Post-AGB stars. Dealing with dust extinction proved to be essential for most stars, and we fit corrections in the form of a polynomial in 1/λ with a “Drude” absorption profile to account for the UV bump.
Future work includes making all spectra observed with the same STIS configuration over the history of HST available for general use. Honed stellar atmospheric parameters is another goal of the project. The library can be used for improving synthetic spectra, observational flux calibration, and even basic teaching about spectral types and stellar atmospheres. Extensions to this project should include fitting the library and making stellar population models for integrated light similar to those of Vazdekis et al. (2016). At that point, the library will be applied to galaxy population synthesis. Due to its UV coverage, it will be uniquely applicable to high redshift galaxies. Due to its inclusion of very hot stars, it will be applicable to starburst objects both local and cosmological.
Acknowledgements
Support for this work was provided by NASA through grant number HST-GO-14141 from the Space Telescope Science Institute, which is operated by AURA, Inc., under NASA contract NAS 5-26555. Based on observations made with the NASA/ESA Hubble Space Telescope, obtained from the data archive at the Space Telescope Science Institute.
Appendix A Gallery of spectra
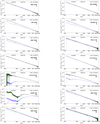 |
Fig. A.1 Library spectra. Fluxes (blue) and extinction-corrected fluxes (black with green error bounds) are plotted along with the corresponding synthetic spectral template (magenta). |
Appendix B Dust extinction parameters
Here we list 40 library stars with their dust extinction parameters. In Table B.1, when only AV is listed, the other dust model parameters revert to their default values: R = 3.1 mag, x0 = 4.596 μm−1, γ = 0.99 μm−1, c2 = −0.824 + 4.717∕R, c1 = 2.030 − 3.007c2, and c3 = 3.23.
List of the 40 newly observed stars.
References
- Allende PrietoC. 2011, MNRAS, 411, 807 [NASA ADS] [CrossRef] [Google Scholar]
- Altmann, M., & de Boer K. S. 2000, A&A, 353, 135 [NASA ADS] [Google Scholar]
- Bagnulo, S., Jehin, E., Ledoux, C., et al. 2003, The Messenger, 114, 10 [NASA ADS] [Google Scholar]
- Bessell, M., & Murphy, S. 2012, PASP, 124, 140 [Google Scholar]
- Biretta, J., et al. 2015, STIS Instrument Handbook, V. 14.0 (Baltimore: STScl) [Google Scholar]
- Bohlin, R. C., Dickinson, M. E., & Calzetti, D. 2001, AJ, 122, 2118 [NASA ADS] [CrossRef] [Google Scholar]
- Bostroem, K., & Proffitt, C. 2011, STIS Data Handbook, V. 6.0 (Baltimore: STScI) [Google Scholar]
- Bruzual, A. G., 1983, ApJ, 273, 105 [NASA ADS] [CrossRef] [Google Scholar]
- Chen, Y.-P., Trager, S. C., Peletier, R. F., et al. 2014, A&A, 565, A117 [NASA ADS] [CrossRef] [EDP Sciences] [Google Scholar]
- Dorman, B., O’Connell, R. W., & Rood, R. T. 1995, ApJ, 442, 105 [NASA ADS] [CrossRef] [Google Scholar]
- Edvardsson, B. 2008, Phys. Scr., 133, 014011 [NASA ADS] [CrossRef] [Google Scholar]
- Fanelli, M. N., O’Connell, R. W., Burstein, D., & Wu, C.-C. 1992, ApJS, 82, 197 [NASA ADS] [CrossRef] [Google Scholar]
- Fitzpatrick, E. L. 1999, PASP, 111, 63 [NASA ADS] [CrossRef] [Google Scholar]
- Fitzpatrick, E. L., & Massa, D. 1986, ApJ, 307, 286 [NASA ADS] [CrossRef] [Google Scholar]
- Fitzpatrick, E. L., & Massa, D. 1990, ApJS, 72, 163 [NASA ADS] [CrossRef] [Google Scholar]
- Gray, R. O., & Corbally, C. J. 2009, Stellar Spectral Classification (Princeton, UK: Princeton University Press) [Google Scholar]
- Gurzadian, G. A., Cholakian, V. G., Kondo, Y., Shore, S. N., & Terzian, Y. 1990, PASP, 102, 1387 [NASA ADS] [CrossRef] [Google Scholar]
- Heap, S. 2009, Constraining the Star-Formation and Metal-Enrichment Histories of Galaxies with the Next Generation Spectral Library, HST Proposal, 11755 [Google Scholar]
- Heap, S., & Lindler, D. J. 2009, Astrophys. Space Sci. Proc., 7, 273 [NASA ADS] [Google Scholar]
- Heap, S. R., & Lindler, D. 2010, BAAS, 42, 494 [NASA ADS] [Google Scholar]
- Heber, U. 1987, Mitt. Astron. Ges. Hamburg, 70, 79 [Google Scholar]
- Heber, U., Hamann, W.-R., Hunger, K., et al. 1984, A&A, 136, 331 [NASA ADS] [Google Scholar]
- Hubeny, I., & Lanz, T. 1995, ApJ, 439, 875 [Google Scholar]
- Koleva, M., & Vazdekis, A. 2012, A&A, 538, A143 [NASA ADS] [CrossRef] [EDP Sciences] [Google Scholar]
- Kurucz, R. 1993, ATLAS9 Stellar Atmosphere Programs and 2 km/s grid. Kurucz CD-ROM No. 13 (Cambridge, MA: Smithsonian Astrophysical Observatory) [Google Scholar]
- Lamontagne, R., Wesemael, F., Fontaine, G., & Sion, E. M. 1985, ApJ, 299, 496 [NASA ADS] [CrossRef] [Google Scholar]
- Lindler, D., & Heap, S. R. 2008, STIS Next Generation Spectral Library (v1), documentation at https://archive.stsci.edu/pub/hlsp/stisngsl/aaareadme.pdf [Google Scholar]
- Lynas-Gray, A. E., Schoenberner, D., Hill, P. W., & Heber, U. 1984, MNRAS, 209, 387 [NASA ADS] [CrossRef] [Google Scholar]
- Mann, A. W., Feiden, G. A., Gaidos, E., Boyajian, T., & von Braun K. 2015, ApJ, 804, 64 [NASA ADS] [CrossRef] [Google Scholar]
- Marschall, L. A., Snyder, G., & Cooper, P. 2013, Am. Astron. Soc. Meeting Abstr., 221, 255.05 [NASA ADS] [Google Scholar]
- Mendez, R. H., Kudritzki, R. P., Herrero, A., Husfeld, D., & Groth, H. G. 1988, A&A, 190, 113 [NASA ADS] [Google Scholar]
- Pancino, E., Britavskiy, N., Romano, D., et al. 2015, MNRAS, 447, 2404 [NASA ADS] [CrossRef] [Google Scholar]
- Pereira, C. B., Gallino, R., & Bisterzo, S. 2012, A&A, 538, A48 [NASA ADS] [CrossRef] [EDP Sciences] [Google Scholar]
- Prugniel, P., & Soubiran, C. 2001, A&A, 369, 1048 [NASA ADS] [CrossRef] [EDP Sciences] [Google Scholar]
- Prugniel, P., Soubiran, C., Koleva, M., & Le Borgne D. 2007, ArXiv e-prints [arXiv:astro-ph/0703658] [Google Scholar]
- Ryans, R. S. I., Dufton, P. L., Mooney, C. J., et al. 2003, A&A, 401, 1119 [NASA ADS] [CrossRef] [EDP Sciences] [Google Scholar]
- Sánchez-Blázquez, P., Peletier, R. F., Jiménez-Vicente, J., et al. 2006, MNRAS, 371, 703 [NASA ADS] [CrossRef] [Google Scholar]
- Sarkar, G., García-Hernández, D. A., Parthasarathy, M., et al. 2012, MNRAS, 421, 679 [NASA ADS] [Google Scholar]
- Vacca, W. D., Garmany, C. D., & Shull, J. M. 1996, ApJ, 460, 914 [NASA ADS] [CrossRef] [Google Scholar]
- Valdes, F., Gupta, R., Rose, J. A., Singh, H. P., & Bell, D. J. 2004, ApJS, 152, 251 [NASA ADS] [CrossRef] [Google Scholar]
- van Dokkum P. G. 2001, PASP, 113, 1420 [NASA ADS] [CrossRef] [Google Scholar]
- Vazdekis, A., Koleva, M., Ricciardelli, E., Röck, B., & Falcón-Barroso, J. 2016, MNRAS, 463, 3409 [Google Scholar]
- Villaume, A., Conroy, C., Johnson, B., et al. 2017, ApJS, 230, 23 [NASA ADS] [CrossRef] [Google Scholar]
- Wenger, M., Ochsenbein, F., Egret, D., et al. 2000, A&AS, 143, 9 [NASA ADS] [CrossRef] [EDP Sciences] [Google Scholar]
- Werner, K., & Herwig, F. 2006, PASP, 118, 183 [NASA ADS] [CrossRef] [Google Scholar]
- Werner, K., Deetjen, J. L., Dreizler, S., Rauch, T., & Kruk, J. W. 2003, IAU Symp., 209, 169 [Google Scholar]
- Wu, C.-C., Ake, T. B., Boggess, A., et al. 1983, NASA IUE Newsl., 22, 324 [Google Scholar]
- Wu, Y., Singh, H. P., Prugniel, P., Gupta, R., & Koleva, M. 2011, A&A, 525, A71 [NASA ADS] [CrossRef] [EDP Sciences] [Google Scholar]
- Yan, R., & the MaStar Team 2017, ASI Conf. Ser., eds. P. Coelho, L. Martins, & E. Griffin, 14, 99 [Google Scholar]
Available at the CDS, at the Mikulski Archive for Space Telescopes (MAST) via doi:10.17909/T9BH65, and also at http://astro.wsu.edu/hotstarlib.
All Tables
All Figures
|
Fig. 1 NGSLstars and our sample in a log Teff, log g diagram.NGSL stars (Koleva & Vazdekis 2012) are separated by abundance, [Fe/H] > −1 (red plus) or [Fe/H] ≤−1 (blue plus). Hot star library candidate stars are marked with circles. The circles are filled for stars that were observed and included in this paper. All O star candidates (blue) were observed, but not all PAGB stars (green) or He-burning stars (red). To guide the eye, an approximate Eddington stability line is drawn, and approximate spectral type boundaries. |
| In the text | |
|
Fig. 2 Example spectra. Spectra as observed (blue) and as extinction corrected (black) with errors (flanking green curves). The no-dust template synthetic spectrum (magenta) overlaps. We show PAGB star NGC 1535 (top), O star HDE 303308 (middle), and horizontal branch star PHL 382 (bottom). Internal program identifications appear below the object name. |
| In the text | |
|
Fig. A.1 Library spectra. Fluxes (blue) and extinction-corrected fluxes (black with green error bounds) are plotted along with the corresponding synthetic spectral template (magenta). |
| In the text | |
Current usage metrics show cumulative count of Article Views (full-text article views including HTML views, PDF and ePub downloads, according to the available data) and Abstracts Views on Vision4Press platform.
Data correspond to usage on the plateform after 2015. The current usage metrics is available 48-96 hours after online publication and is updated daily on week days.
Initial download of the metrics may take a while.