Fig. 8
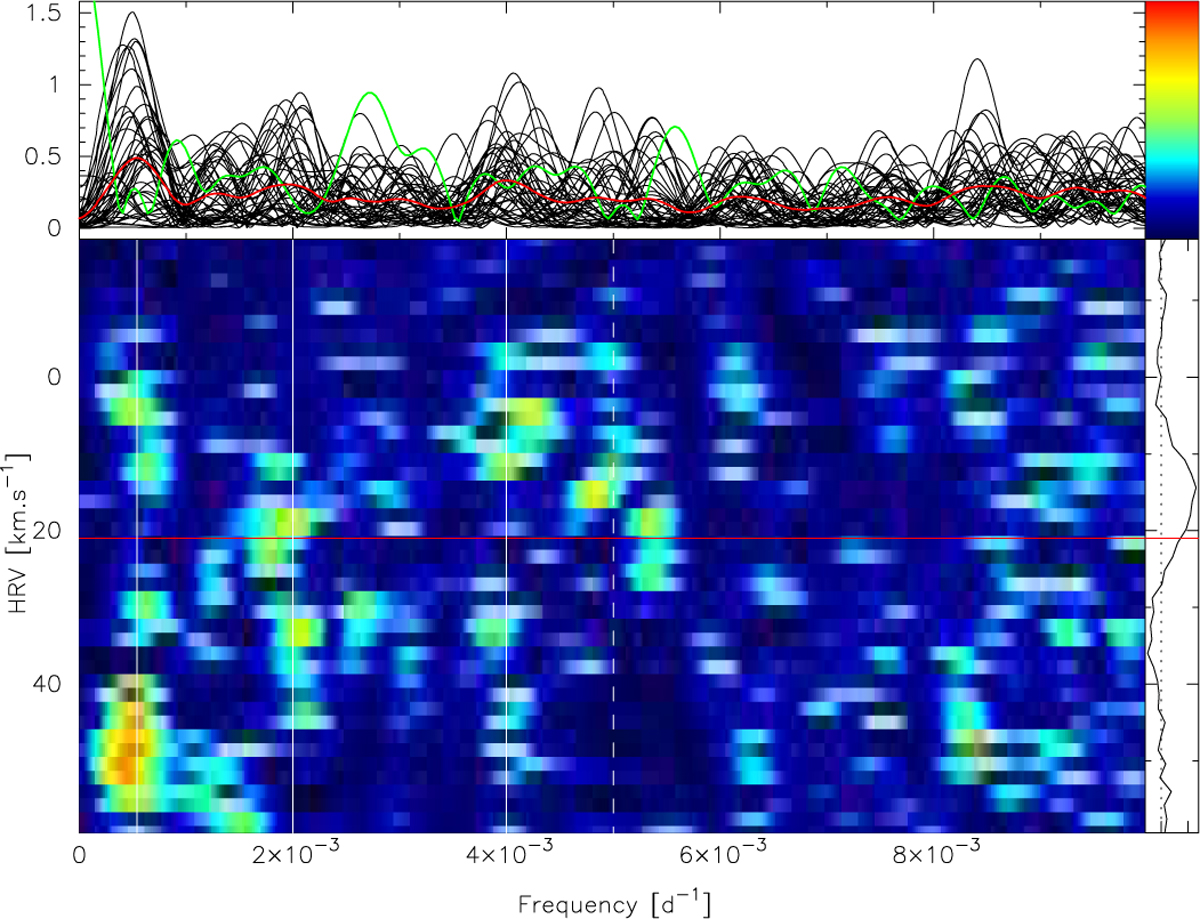
2D Fourier analysis of the Stokes V parameter. The horizontal red line represents the star velocity, 21 km s−1. The vertical white bars represent the three frequencies around 1850 d, 500 d and 250 d, while the dotted white line marks a signal around 200 d. The above picture shows, for each velocity-bin, the Fourier periodograms together with its average (red) and window function (green). On the right is shown the mean-V profile together with the star velocity (red), while the dotted line represents the null polarization level.
Current usage metrics show cumulative count of Article Views (full-text article views including HTML views, PDF and ePub downloads, according to the available data) and Abstracts Views on Vision4Press platform.
Data correspond to usage on the plateform after 2015. The current usage metrics is available 48-96 hours after online publication and is updated daily on week days.
Initial download of the metrics may take a while.