Open Access
Fig. 5
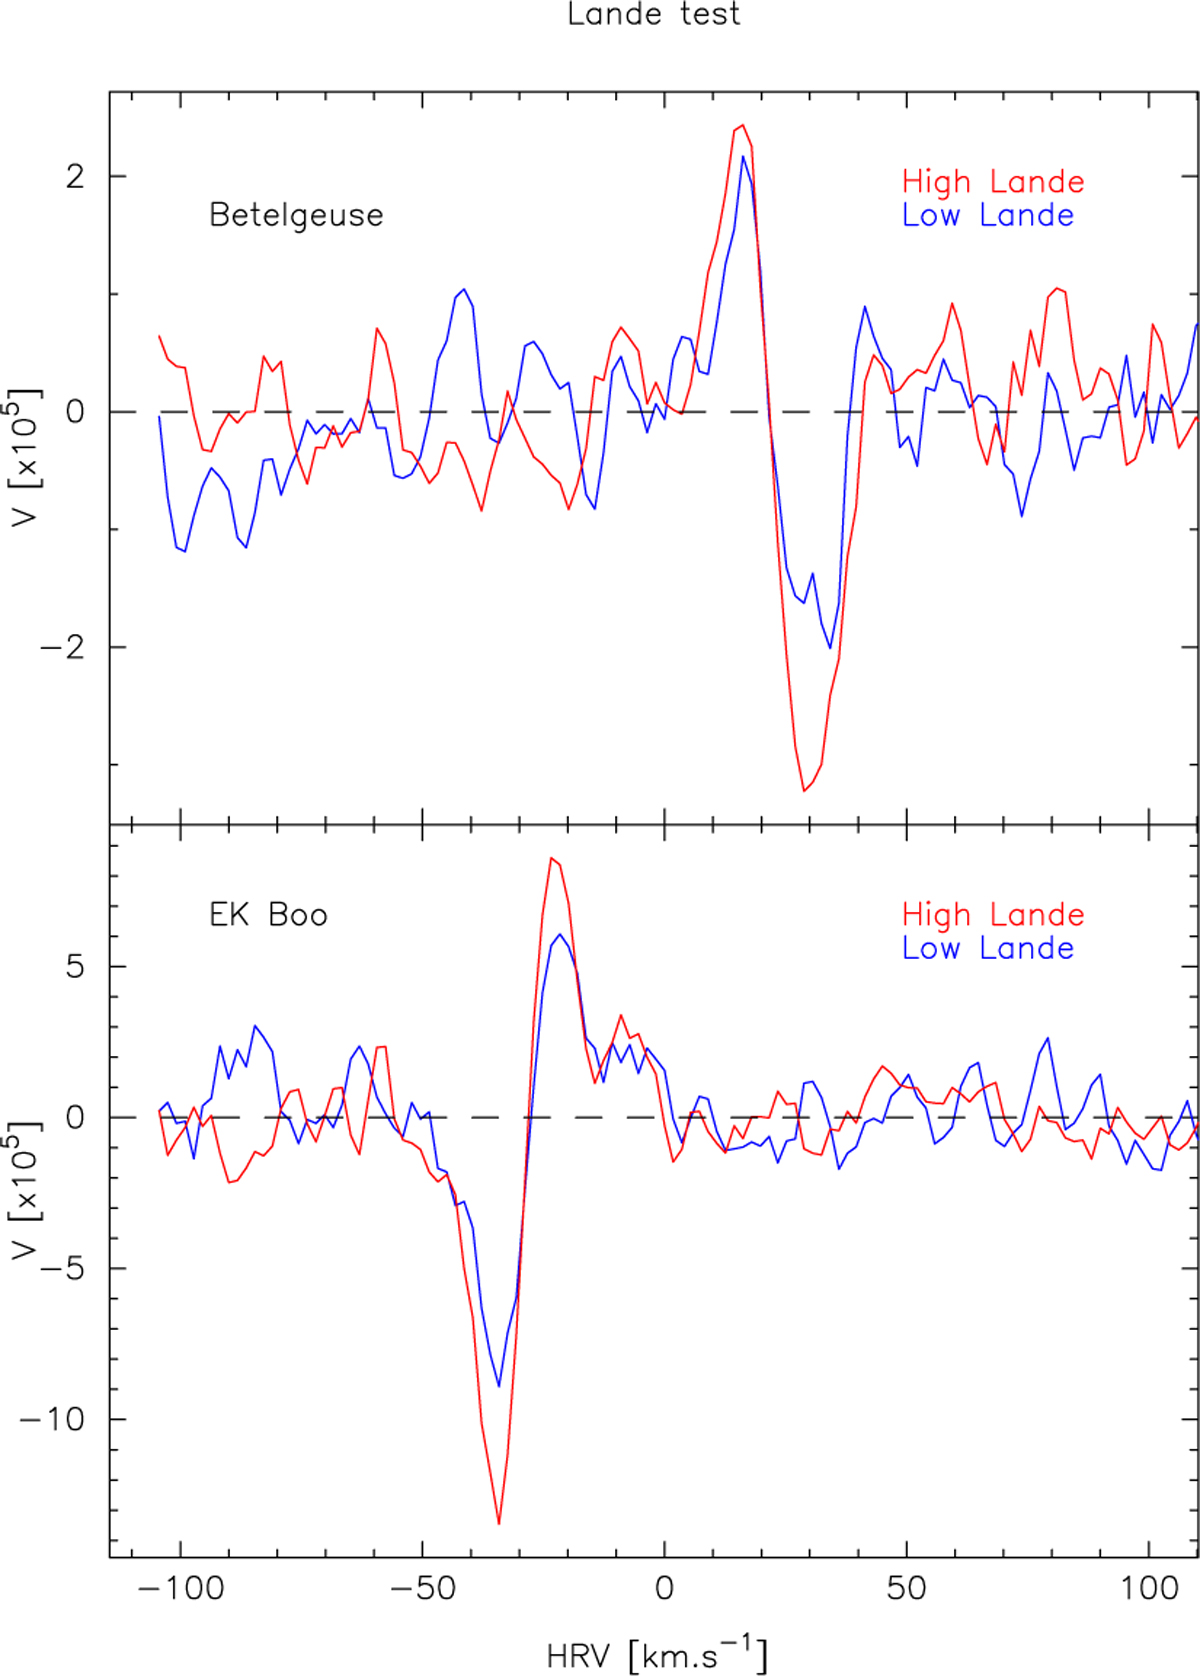
Comparison of Stokes V profiles obtained by selecting photospheric lines of low (blue line) and high (red line) magnetic sensitivity according to the Landé factor. Top panel: Betelgeuse on December 9, 2010. Bottom panel: the magnetic M giant EK Boo on March 18, 2009.
Current usage metrics show cumulative count of Article Views (full-text article views including HTML views, PDF and ePub downloads, according to the available data) and Abstracts Views on Vision4Press platform.
Data correspond to usage on the plateform after 2015. The current usage metrics is available 48-96 hours after online publication and is updated daily on week days.
Initial download of the metrics may take a while.