Fig. 4
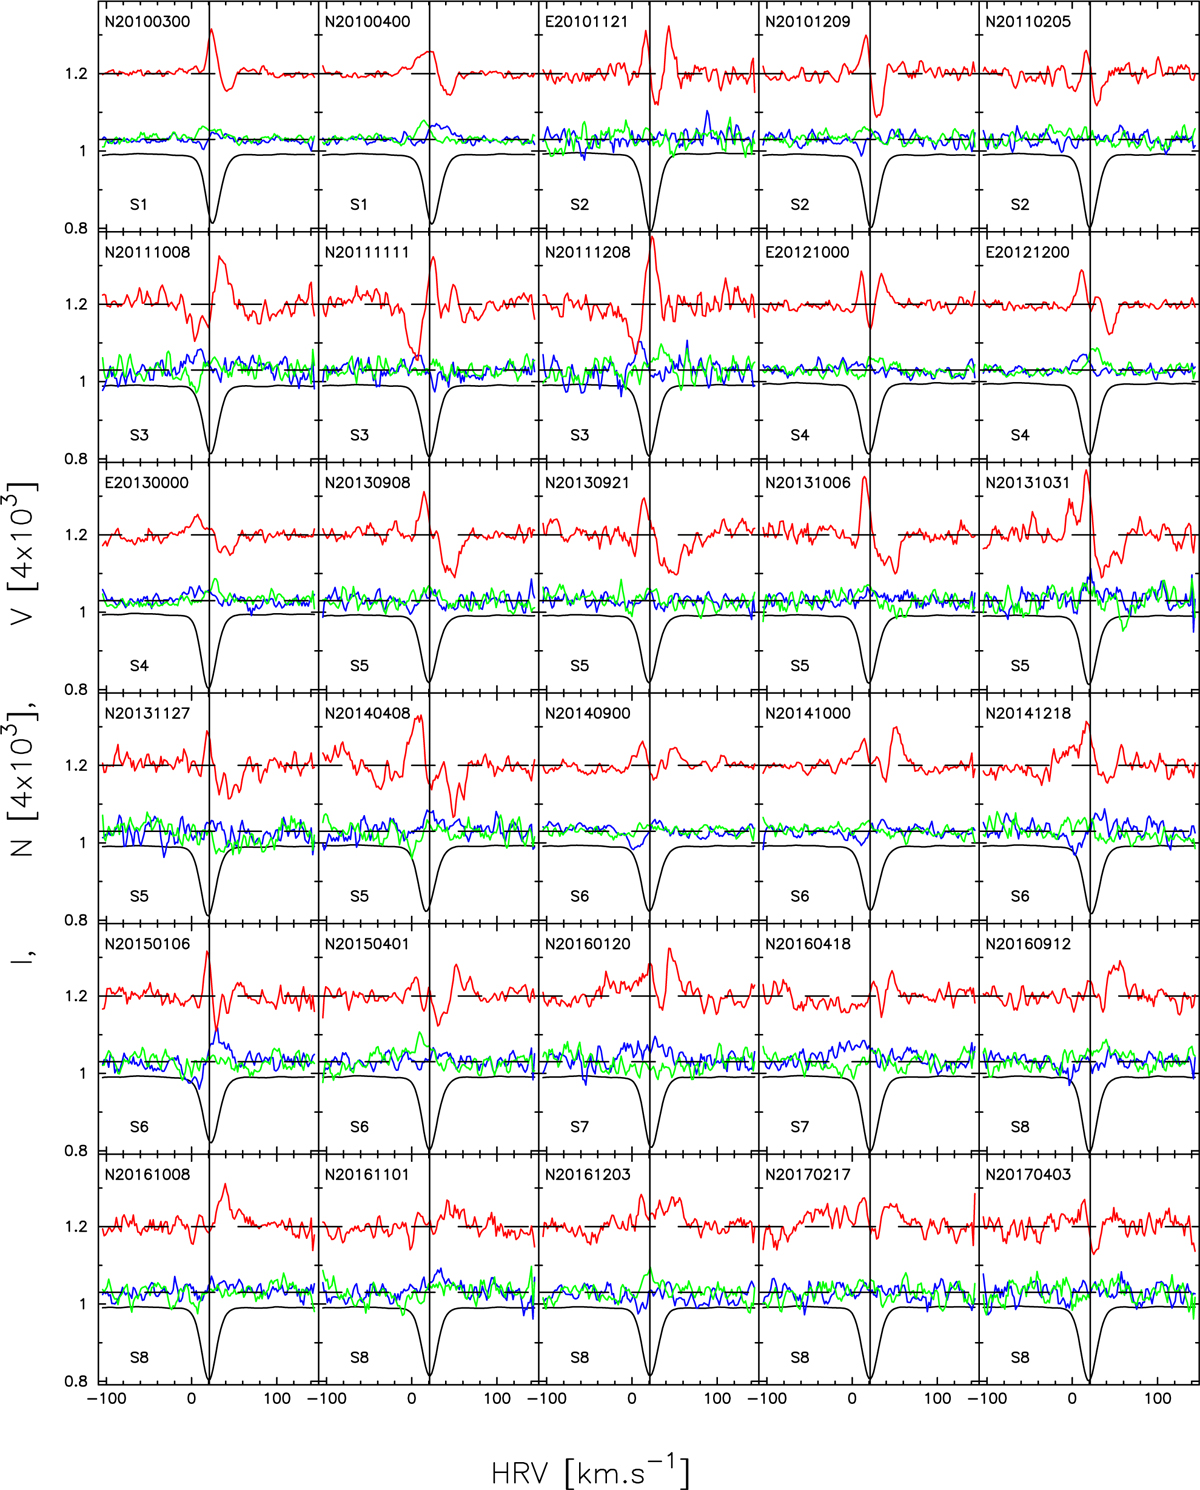
StokesV (red), null polarization N1 (blue) and N2 (green), and I (black) LSD profiles of Betelgeuse for the 30 dates selected as described in Sect. 3.2and spanning along the eight seasons between March 2010 and April 2017 (Table A.1). We note that the UT observation date is encoded for each retained night (see Table A.1). The vertical line corresponds to the HRV of Betelgeuse (about 21 km s−1).
Current usage metrics show cumulative count of Article Views (full-text article views including HTML views, PDF and ePub downloads, according to the available data) and Abstracts Views on Vision4Press platform.
Data correspond to usage on the plateform after 2015. The current usage metrics is available 48-96 hours after online publication and is updated daily on week days.
Initial download of the metrics may take a while.