Fig. 2
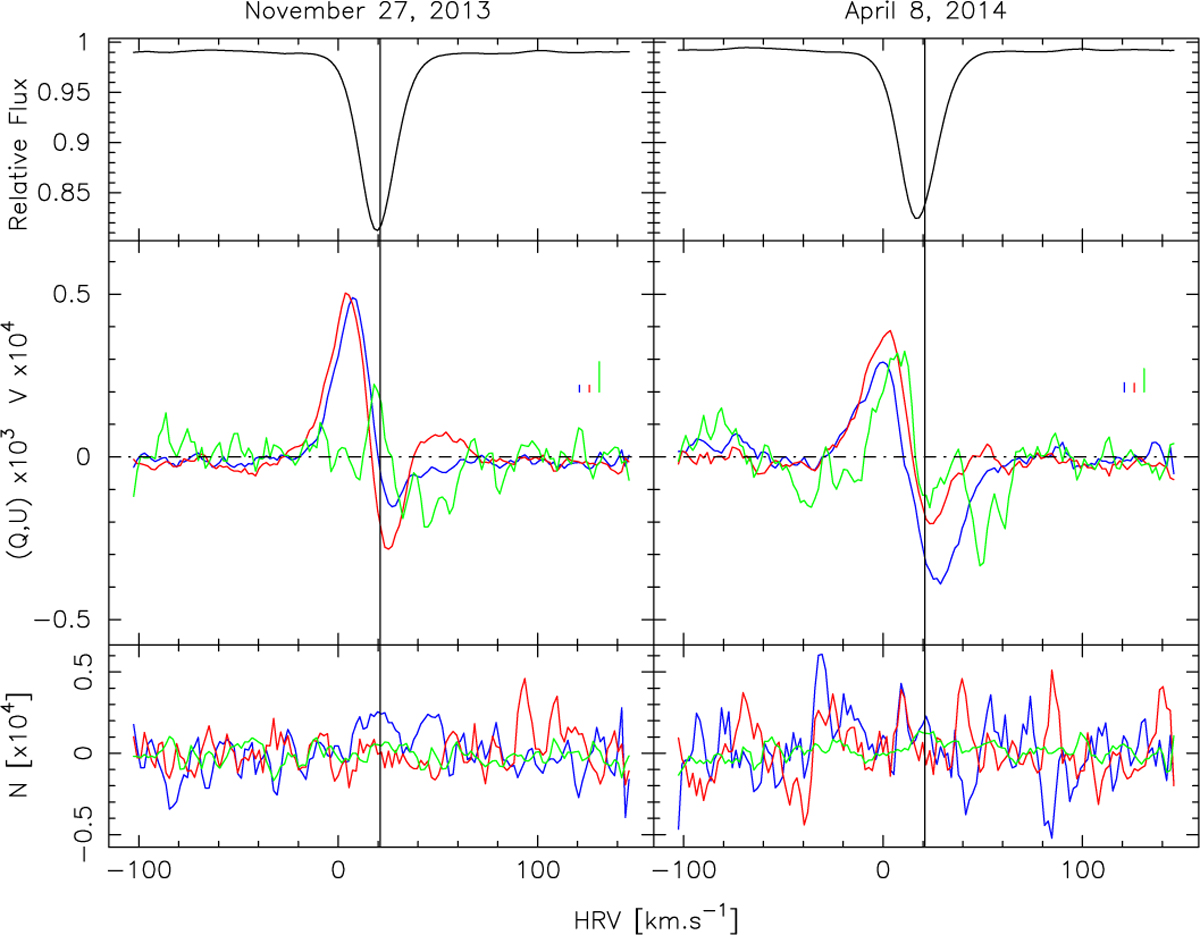
IQUV LSD profiles of Betelgeuse for 27 November 2013 and April 8, 2014. Top panel: Stokes I. Middle panel: Stokes Q (blue), U (red), and V (green) signals, where the V signal has been magnified by a factor ten. Bottom panel: null polarization signal N1 , with the same color code as for the Stokes parameters. Small vertical lines represent typical error bars with the same color code. The vertical line corresponds to the HRV of Betelgeuse (about 21 km s−1).
Current usage metrics show cumulative count of Article Views (full-text article views including HTML views, PDF and ePub downloads, according to the available data) and Abstracts Views on Vision4Press platform.
Data correspond to usage on the plateform after 2015. The current usage metrics is available 48-96 hours after online publication and is updated daily on week days.
Initial download of the metrics may take a while.