Fig. 10
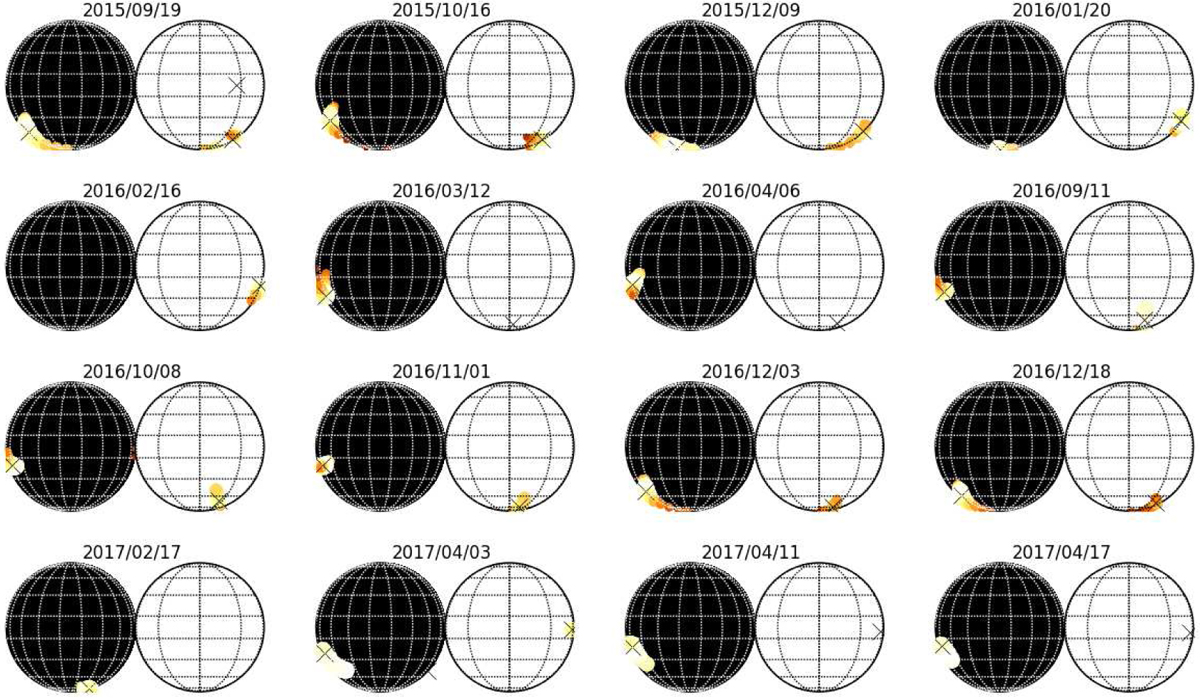
Sequence of images of Betelgeuse from linear polarization for the dates given in Table 1. North is up and east is left for all images. For each date the image (relative intensities) on the left represents the blueshifted signals (spot1) which are located on the visible hemisphere; the image on the right represents the redshifted signals (spot2) which are supposed to correspond to the opposite hemisphere. The crosses show the positions corresponding to the maxima of the linear polarization. The model used is described in Aurière et al. (2016).
Current usage metrics show cumulative count of Article Views (full-text article views including HTML views, PDF and ePub downloads, according to the available data) and Abstracts Views on Vision4Press platform.
Data correspond to usage on the plateform after 2015. The current usage metrics is available 48-96 hours after online publication and is updated daily on week days.
Initial download of the metrics may take a while.