Fig. 8
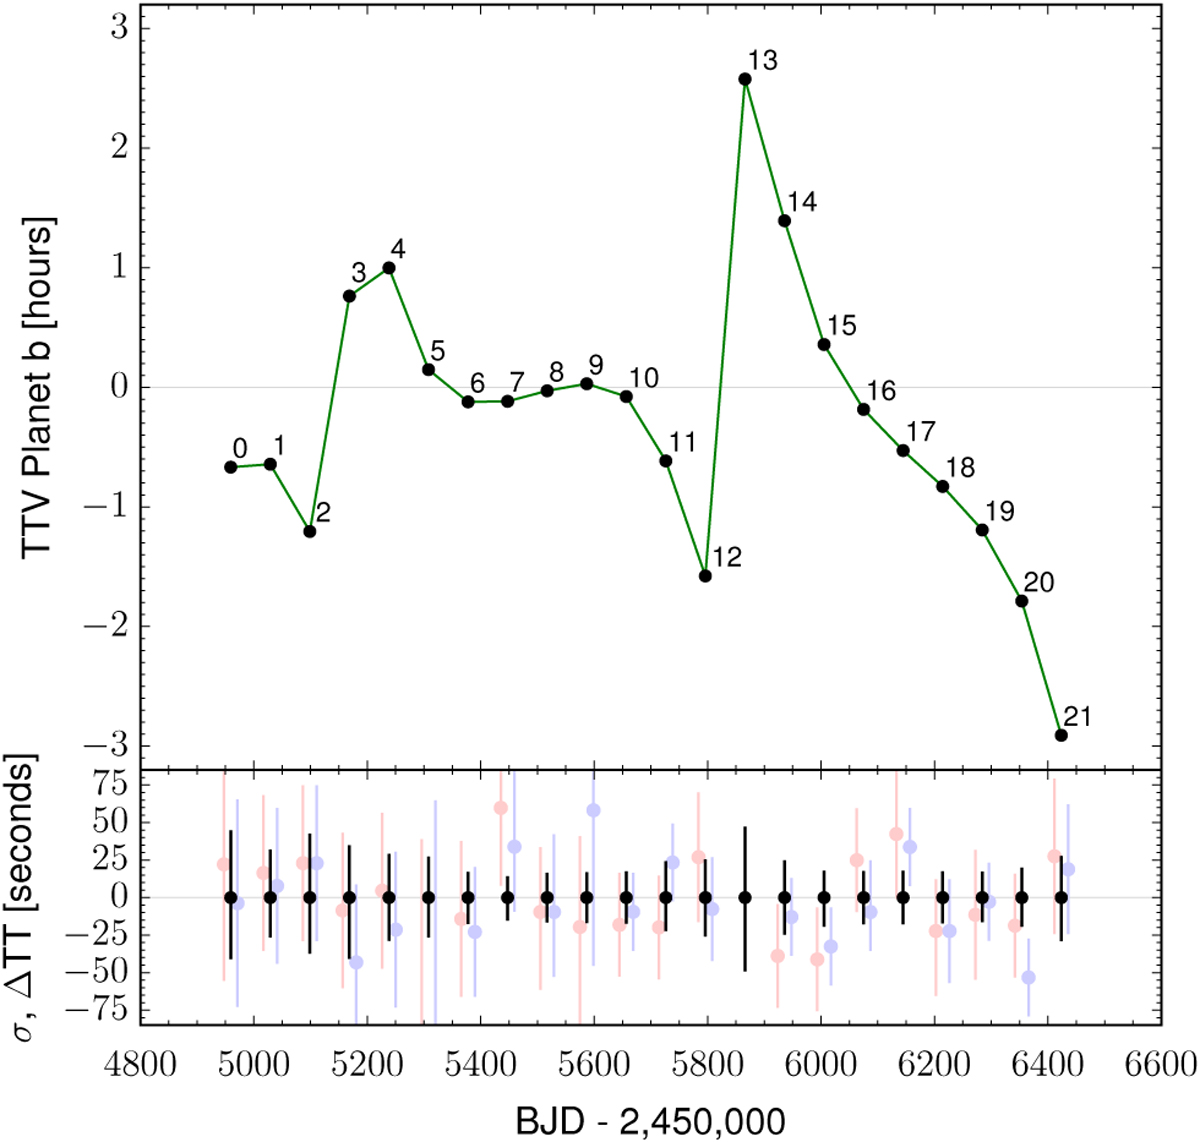
Posterior TTVs of Kepler-419b, computed relative to a linear ephemeris computed using the median values of each epoch during Kepler observations (BJDTDB = 2 454 959.358(23) + 69.728 8(21) × Epoch, where the errors are indicated in parentheses). A thousand random draws from the posterior distribution are used to estimatethe TTV median value and its uncertainty. In the upper panel the median TTV values are labelled with the corresponding epoch number (0 is the first transit observed by Kepler). In the lower panel, the posterior median transit timing value is subtracted to visualise the uncertainty of the distribution. The two sets of transit times derived in Dawson et al. (2014) are shown in light red (TAP) and light blue (GP), slightly offset in the x-direction for clarity. The median transit time was subtracted from each epoch to allow for comparison with our results.
Current usage metrics show cumulative count of Article Views (full-text article views including HTML views, PDF and ePub downloads, according to the available data) and Abstracts Views on Vision4Press platform.
Data correspond to usage on the plateform after 2015. The current usage metrics is available 48-96 hours after online publication and is updated daily on week days.
Initial download of the metrics may take a while.