Fig. 7
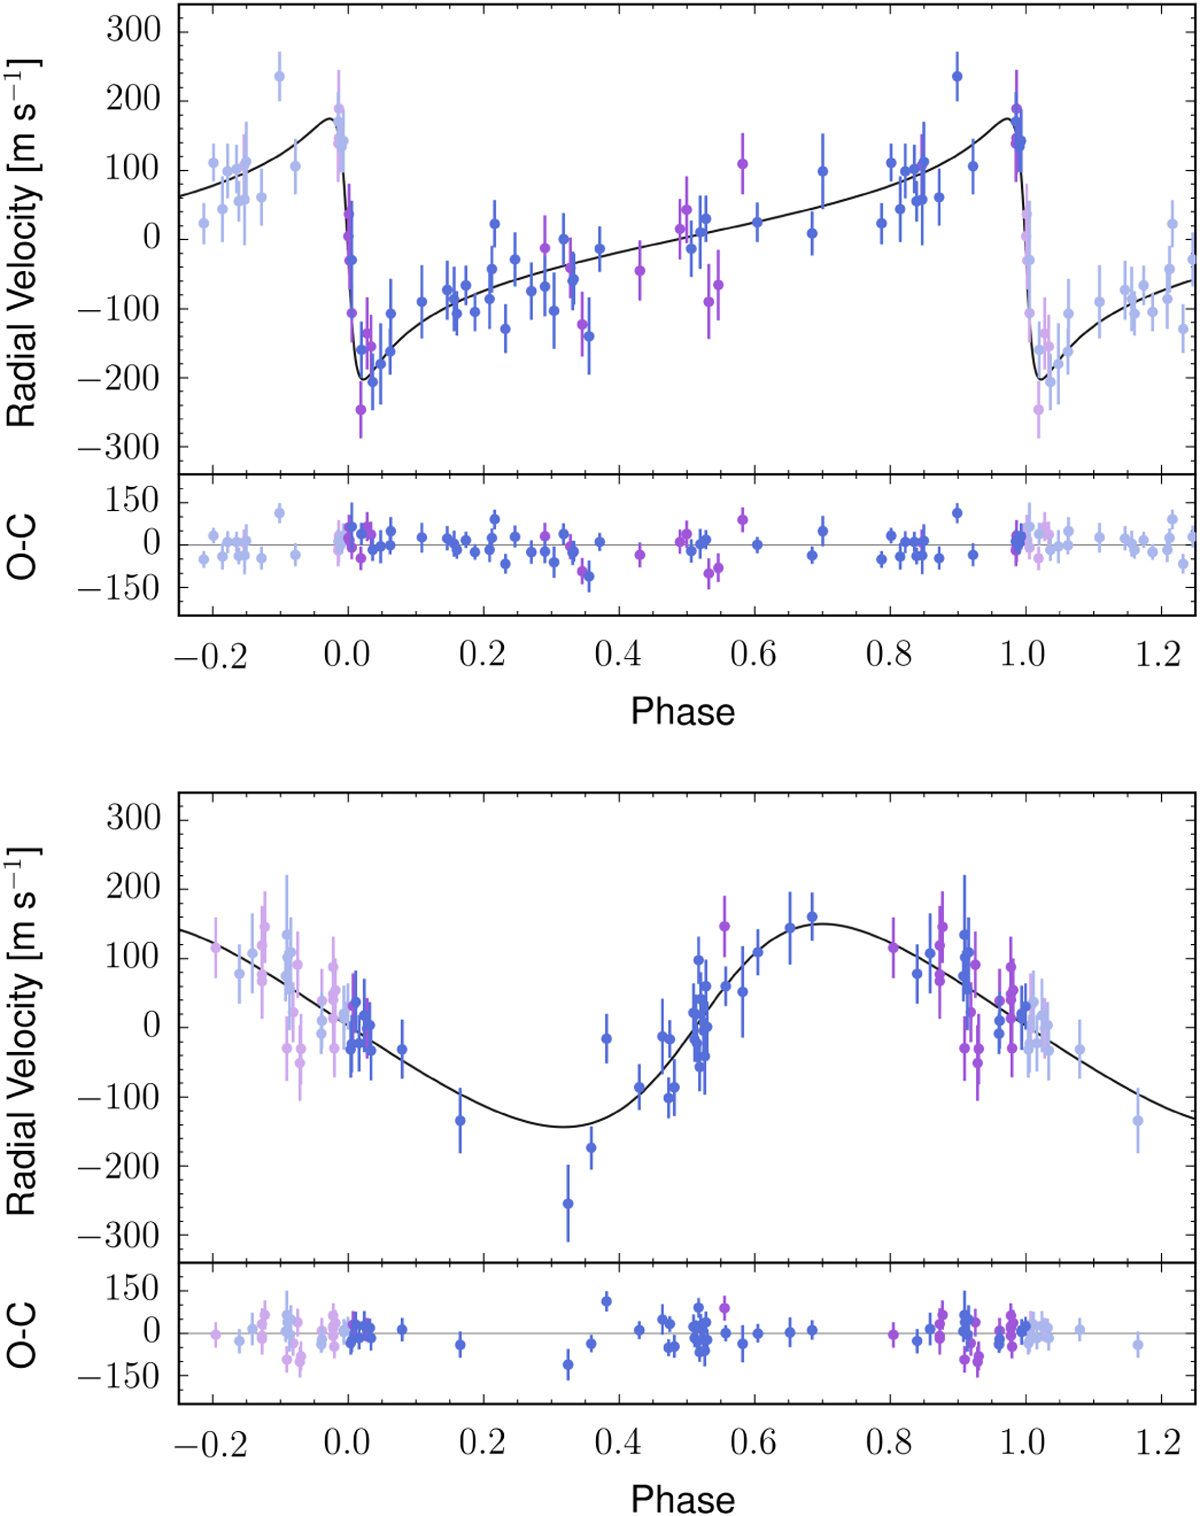
Phase-folded radial velocities for planet b (top) and c (bottom). The points are colour-coded as in Fig. 2 (blue for SOPHIE and purple for HIRES). In the photodynamical model the contribution to RV signal coming from individual planets cannot be separated. Therefore, these figures are constructed by fitting a two-Keplerian model to the photodynamical MAP model radial velocities, and subtracting the individual contribution of each planet from the data. The uncertainties include the MAP jitter value.
Current usage metrics show cumulative count of Article Views (full-text article views including HTML views, PDF and ePub downloads, according to the available data) and Abstracts Views on Vision4Press platform.
Data correspond to usage on the plateform after 2015. The current usage metrics is available 48-96 hours after online publication and is updated daily on week days.
Initial download of the metrics may take a while.