Fig. 4
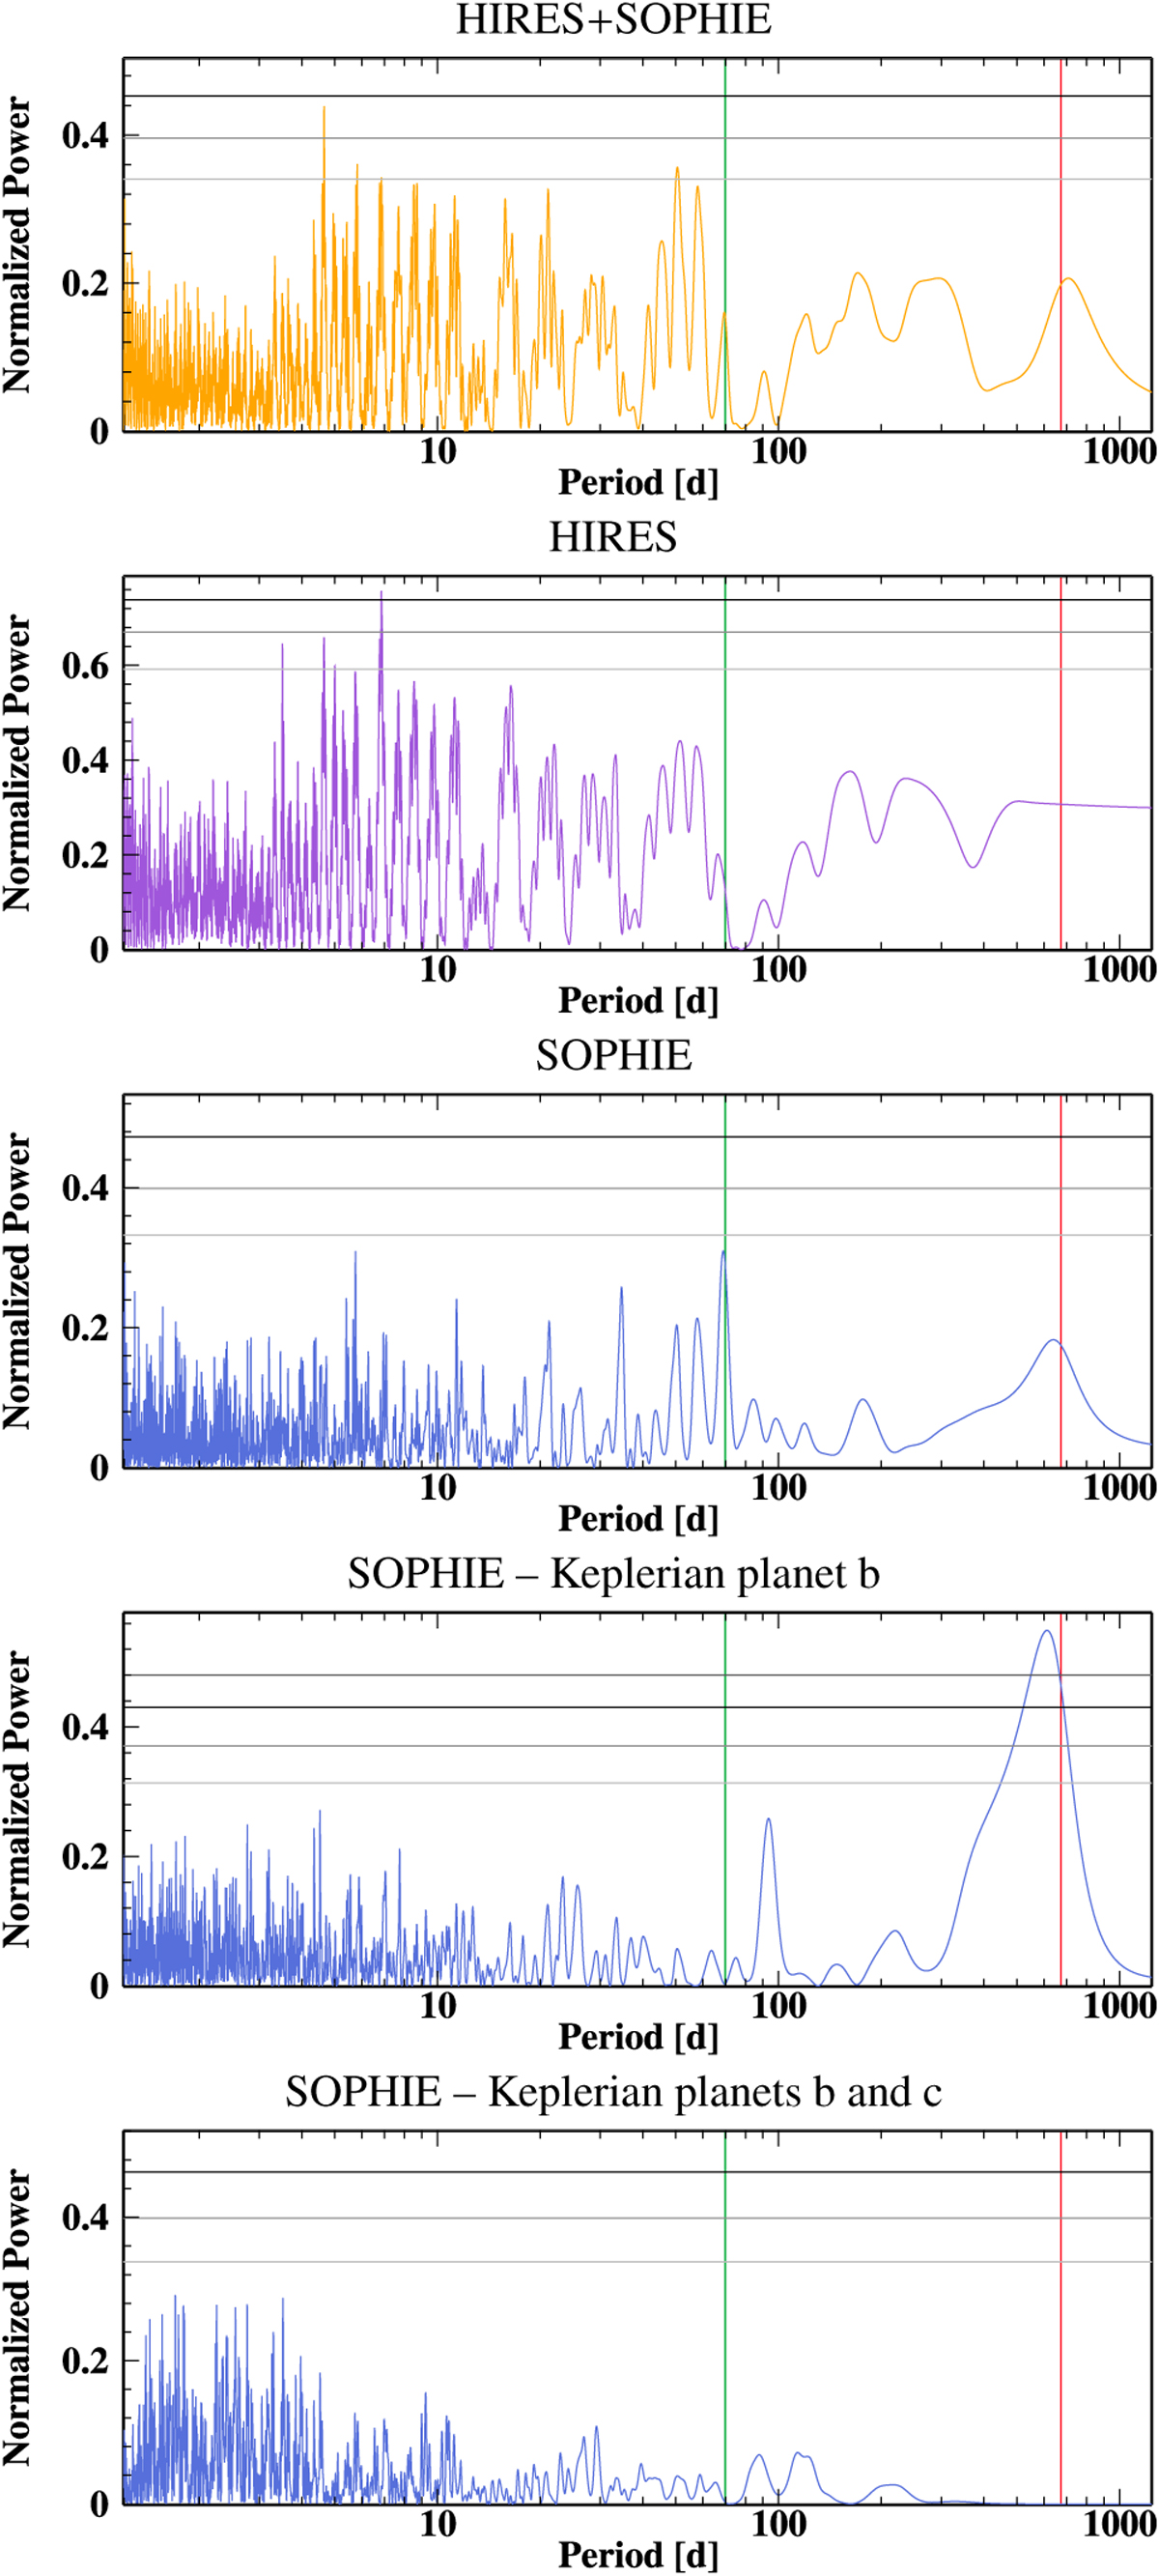
Generalised Lomb–Scargle periodograms of the radial velocities. The green and red vertical lines mark the period of planet b and c, respectively. The grey horizontal lines represent the 50, 10, and 1% p-value levels. From top to bottom: HIRES and SOPHIE data; HIRES velocities; SOPHIE velocities; SOPHIE after substraction of Keplerian curve at the period of planet b; SOPHIE velocities after substraction of a two-Keplerian model with the periods of planets b and c. The periodogram plots are provided by DACE (dace.unige.ch).
Current usage metrics show cumulative count of Article Views (full-text article views including HTML views, PDF and ePub downloads, according to the available data) and Abstracts Views on Vision4Press platform.
Data correspond to usage on the plateform after 2015. The current usage metrics is available 48-96 hours after online publication and is updated daily on week days.
Initial download of the metrics may take a while.