Free Access
Fig. A.4
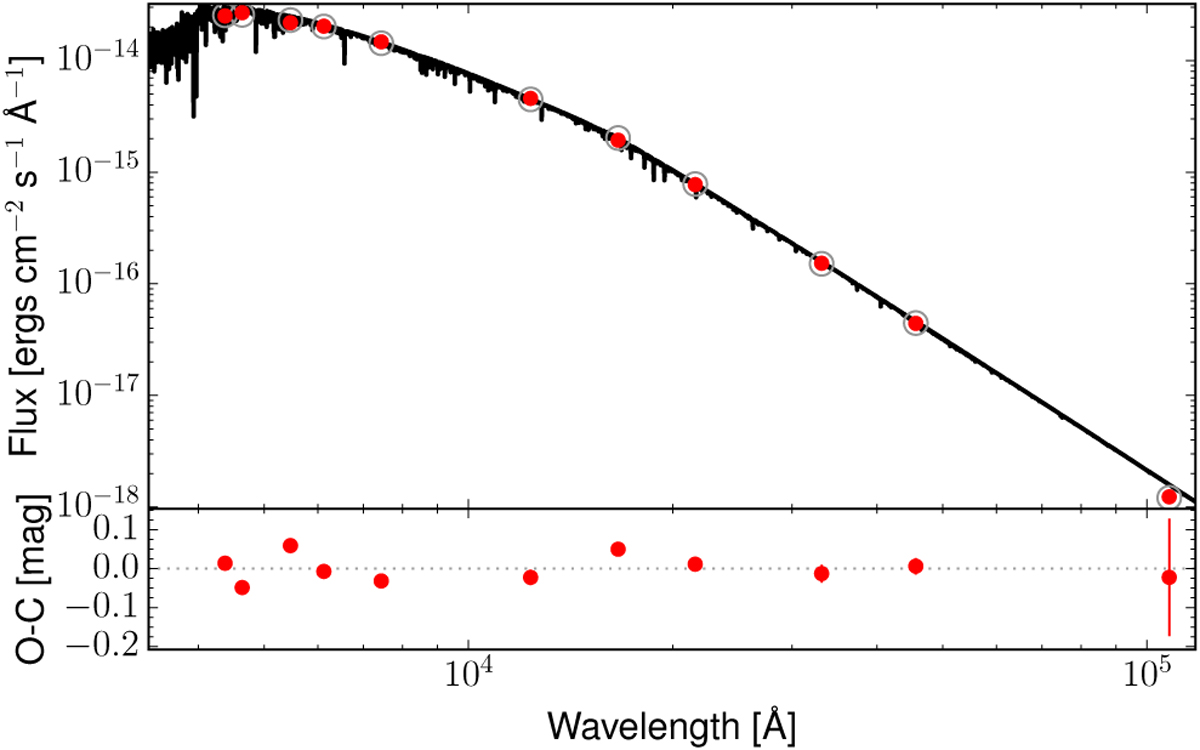
Spectral energy distribution of Kepler-419 based on magnitudes from the literature (red circles; see text for details). The best-fit spectrum is plotted as a solid black curve, and the integrated fluxes in the photometric bands are plotted as open circles. The residuals are given in the bottom panel.
Current usage metrics show cumulative count of Article Views (full-text article views including HTML views, PDF and ePub downloads, according to the available data) and Abstracts Views on Vision4Press platform.
Data correspond to usage on the plateform after 2015. The current usage metrics is available 48-96 hours after online publication and is updated daily on week days.
Initial download of the metrics may take a while.