Fig. 11
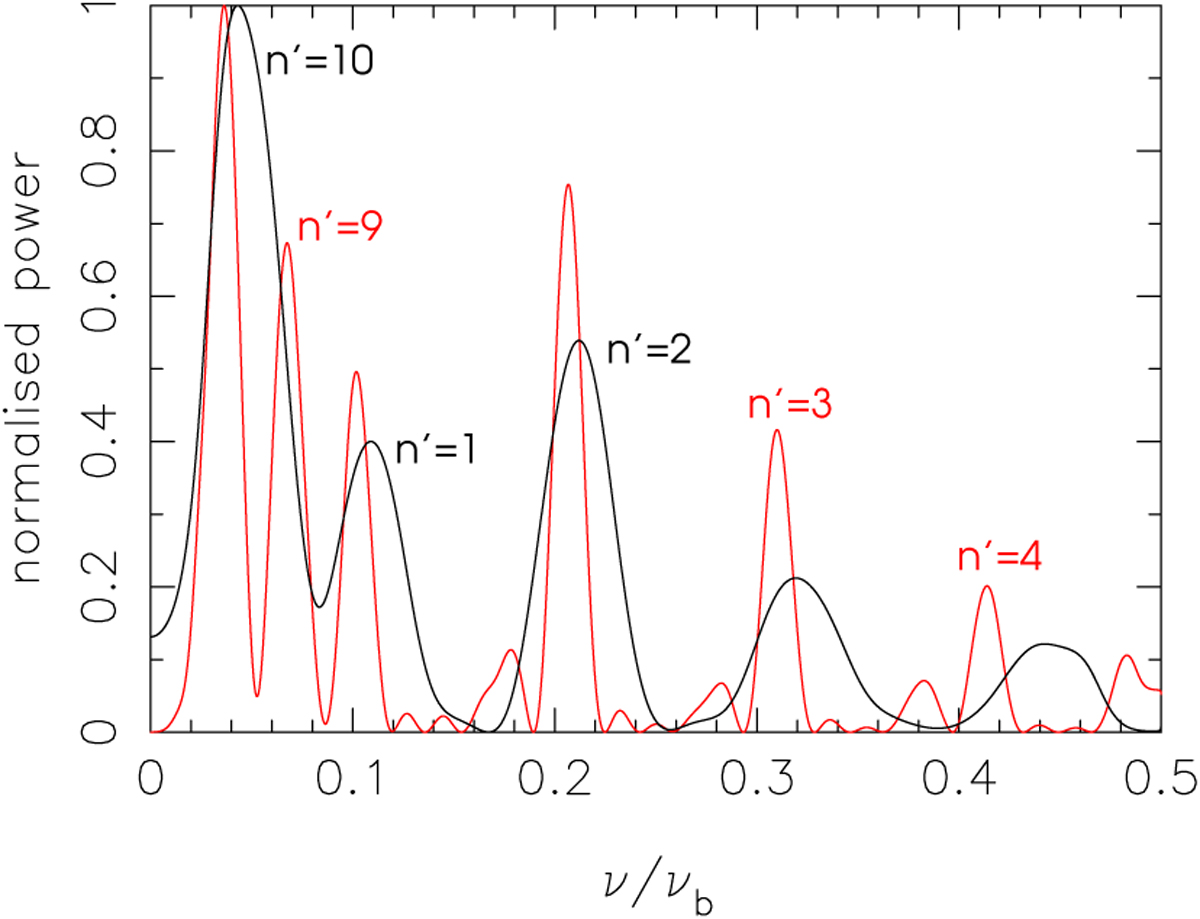
Lomb–Scargle periodogram of the TTVs for 22 transits (black curve) and 54 transits (red curve), with dominant frequencies labelled (see text). Normalised power is plotted against frequency in units of the orbital frequency νb of planet b. Only the Nyquist window 0 ≤ ν∕νb ≤ 1∕2 is shown; higher frequencies are aliases of these values.
Current usage metrics show cumulative count of Article Views (full-text article views including HTML views, PDF and ePub downloads, according to the available data) and Abstracts Views on Vision4Press platform.
Data correspond to usage on the plateform after 2015. The current usage metrics is available 48-96 hours after online publication and is updated daily on week days.
Initial download of the metrics may take a while.