Fig. 10
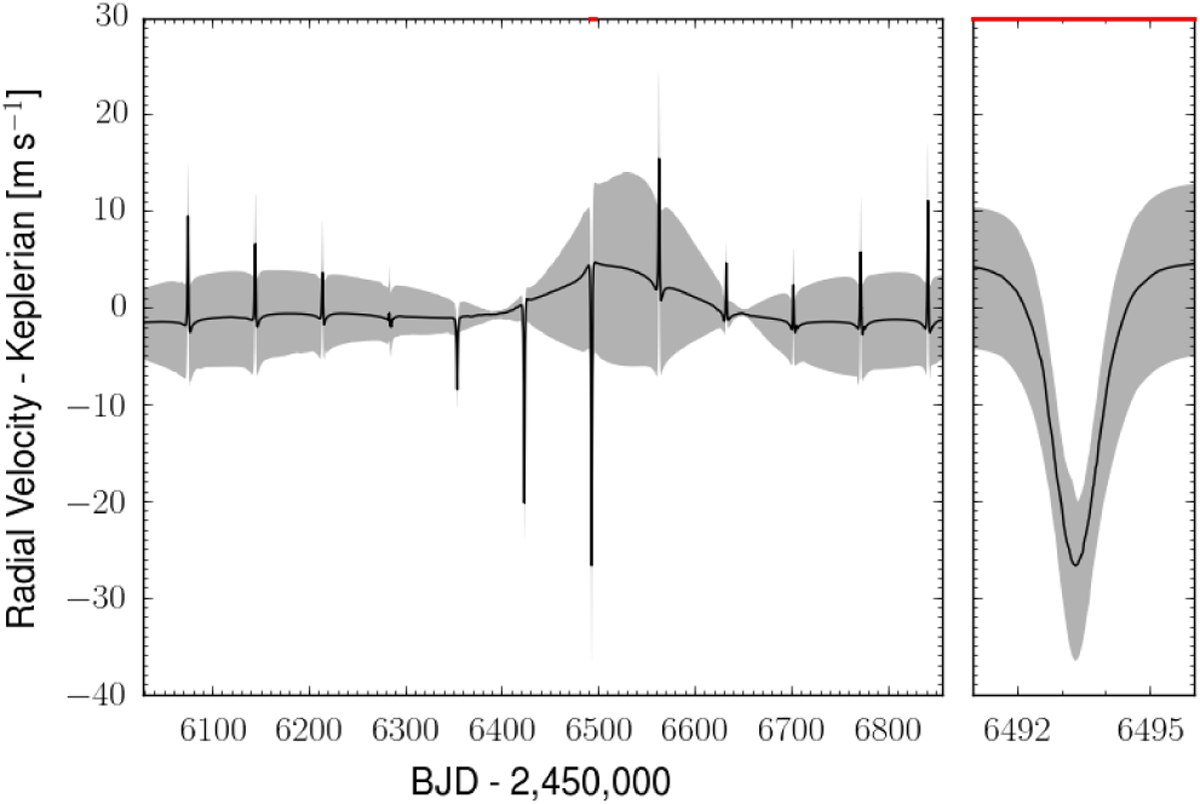
Difference between the stellar radial velocity (computed with the n-body integration) and a two-Keplerian fit to the model prediction, computed over 100 random MCMC samples from the full photodynamic model. The black line and the grey shaded region represent the median and the 68.3% confidence interval, respectively. The smaller panel is an enlargementaround the maximum difference, marked in red in the main panel.
Current usage metrics show cumulative count of Article Views (full-text article views including HTML views, PDF and ePub downloads, according to the available data) and Abstracts Views on Vision4Press platform.
Data correspond to usage on the plateform after 2015. The current usage metrics is available 48-96 hours after online publication and is updated daily on week days.
Initial download of the metrics may take a while.