Fig. 1
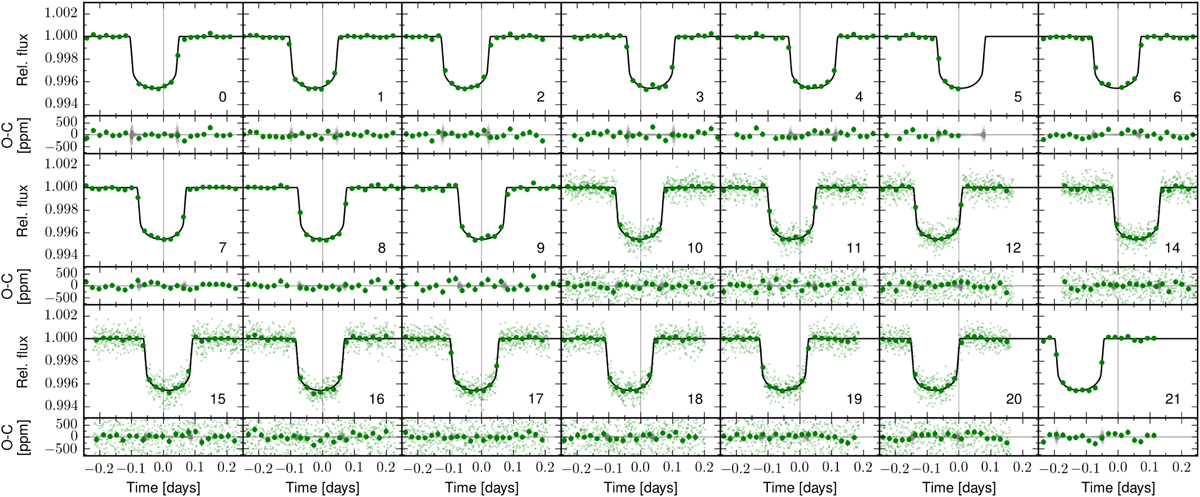
Transits of Kepler-419b observed by Kepler. Each panel is centred at the linear ephemeris (indicated by the vertical grey lines, and reported in the caption of Fig. 8). For short-cadence data, 29.4-minute binned data is shown in addition to the observed data points. Each panel is labelled with the epoch; zero is the first transit after tref. The black curve is the median oversampled model over 10 000 random MCMC steps. In the lower part of each panel the residuals after subtracting the MAP model to the observed data are shown. The shades of grey represent the 68.3, 95.5, and 99.7% credible intervals, which are hardly distinguishable in the residual panels and show an increased uncertainty at ingress and egress times.
Current usage metrics show cumulative count of Article Views (full-text article views including HTML views, PDF and ePub downloads, according to the available data) and Abstracts Views on Vision4Press platform.
Data correspond to usage on the plateform after 2015. The current usage metrics is available 48-96 hours after online publication and is updated daily on week days.
Initial download of the metrics may take a while.