Fig. 9
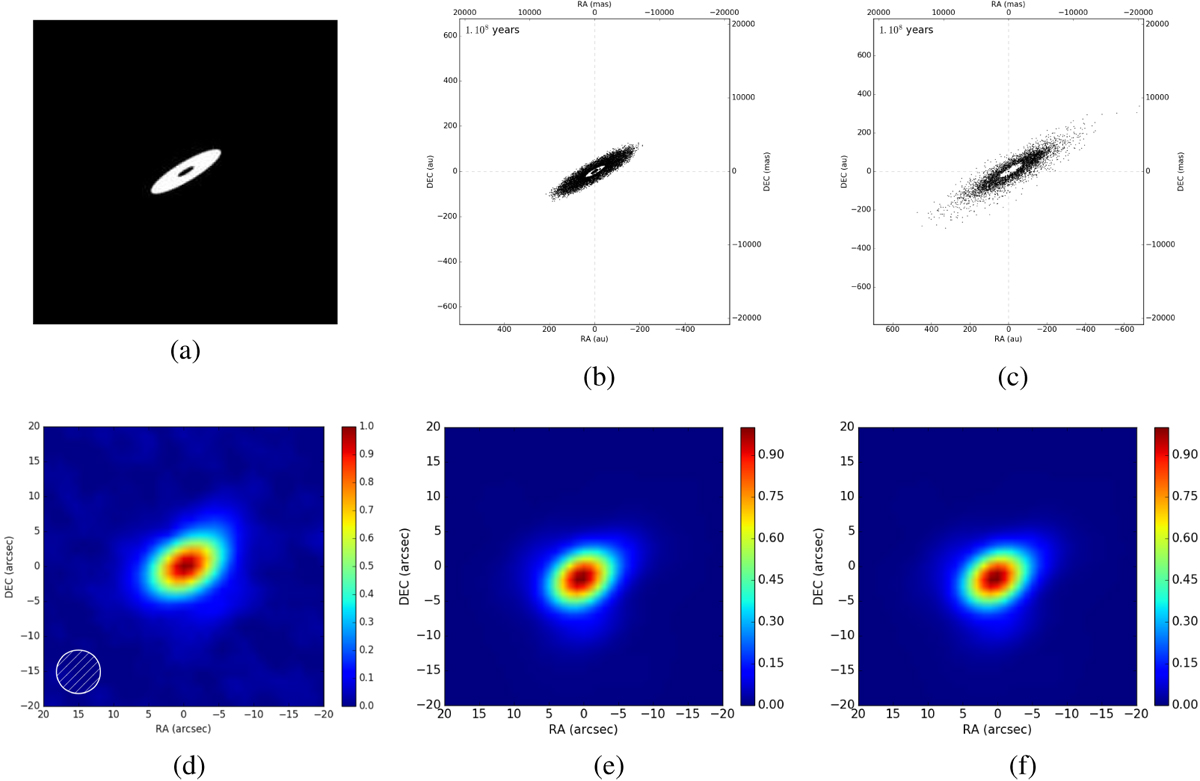
Panel a: geometrical fit to the Herschel/PACS image at 70 μm adapted from Moór et al. (2015) shown in panel d. Panels b and c: simulated images consistent with the estimated disk cavity for a circular configuration (a = 30 au, e = 0) and for an eccentric configuration (a = 40 au, e = 0.4), respectively.Panel d: Herschel image. Panels e and f: synthetic Herschel images corresponding to panels b and c (see text).
Current usage metrics show cumulative count of Article Views (full-text article views including HTML views, PDF and ePub downloads, according to the available data) and Abstracts Views on Vision4Press platform.
Data correspond to usage on the plateform after 2015. The current usage metrics is available 48-96 hours after online publication and is updated daily on week days.
Initial download of the metrics may take a while.