Fig. 3
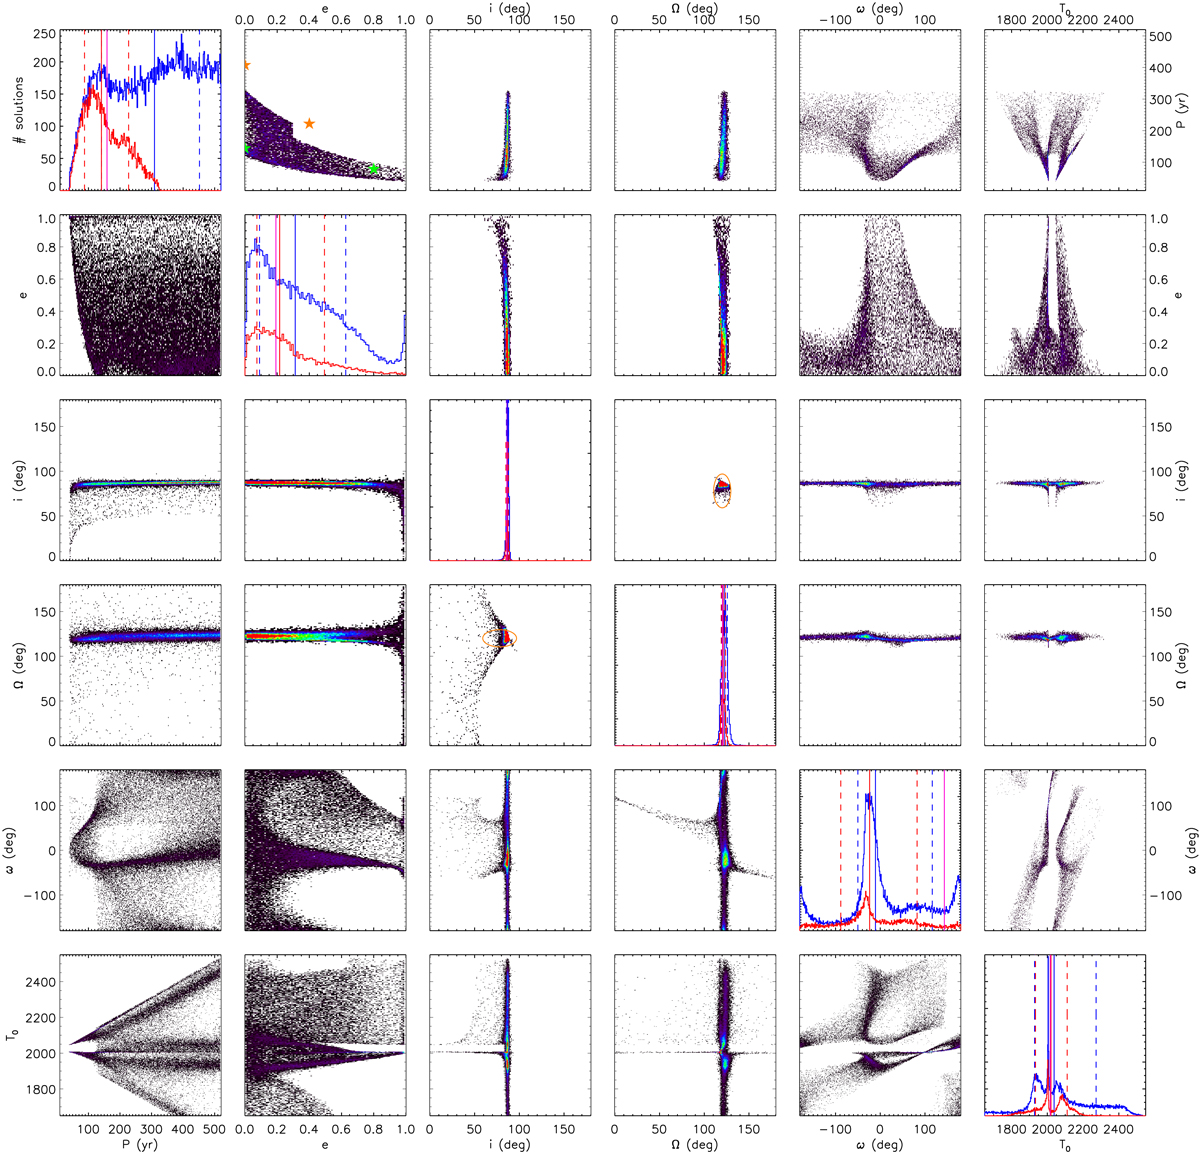
LSMC distributions of the six Campbell orbital elements for all the fitted solutions with ![]() < 2 among 2 000000 random trials. The diagrams displayed on the diagonal from top left to lower right represent the 1D histograms for the individual elements (blue: all solutions, red: solutions compatible with the estimated disk geometry at 3σ and disk cavity size). The off-diagonal diagrams show the correlations between pairs of orbital elements, with diagrams below and to the left of the diagonal showing all the fitted solutions, and the diagrams above and to the right of the diagonal only showing solutions which are compatible with the estimated disk geometry and cavitysize (see Sect. 5). The linear color scale in the correlation plots account for the relative local density of orbital solutions. In the histograms, the purple and magenta solid lines indicate the best χ2 fitted solutions for all solutions and the disk-compatible solutions, respectively. The solid and dashed lines of a given color show the 50% percentile values and the intervals at 68% (blue: all solutions, red: disk-compatible solutions). The orange ellipses in the i-Ω plots show the disk inclination and position angle estimated by Moór et al. (2015) at 3σ. The stars in the eccentricity-period diagram for the restricted solutions (top row, second panel from the left) indicate the configurations tested in the N-body simulations described in Sect. 5 (green: allowed, orange: excluded).
< 2 among 2 000000 random trials. The diagrams displayed on the diagonal from top left to lower right represent the 1D histograms for the individual elements (blue: all solutions, red: solutions compatible with the estimated disk geometry at 3σ and disk cavity size). The off-diagonal diagrams show the correlations between pairs of orbital elements, with diagrams below and to the left of the diagonal showing all the fitted solutions, and the diagrams above and to the right of the diagonal only showing solutions which are compatible with the estimated disk geometry and cavitysize (see Sect. 5). The linear color scale in the correlation plots account for the relative local density of orbital solutions. In the histograms, the purple and magenta solid lines indicate the best χ2 fitted solutions for all solutions and the disk-compatible solutions, respectively. The solid and dashed lines of a given color show the 50% percentile values and the intervals at 68% (blue: all solutions, red: disk-compatible solutions). The orange ellipses in the i-Ω plots show the disk inclination and position angle estimated by Moór et al. (2015) at 3σ. The stars in the eccentricity-period diagram for the restricted solutions (top row, second panel from the left) indicate the configurations tested in the N-body simulations described in Sect. 5 (green: allowed, orange: excluded).
Current usage metrics show cumulative count of Article Views (full-text article views including HTML views, PDF and ePub downloads, according to the available data) and Abstracts Views on Vision4Press platform.
Data correspond to usage on the plateform after 2015. The current usage metrics is available 48-96 hours after online publication and is updated daily on week days.
Initial download of the metrics may take a while.