Fig. 2
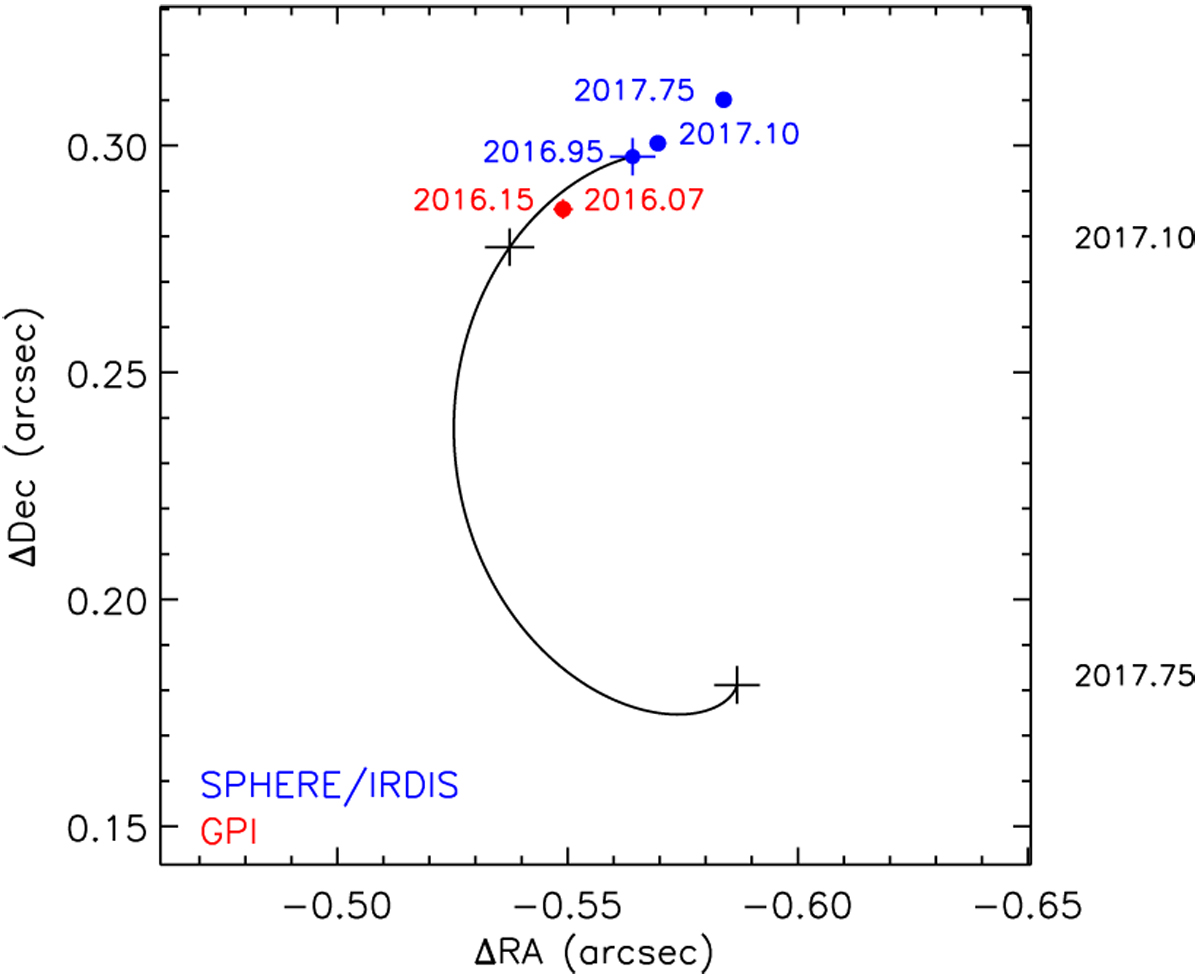
SPHERE relative astrometry of HR 2562 B (blue points). The black curve shows its motion if it is a stationary background object. The black crosses represent the locations at epochs 2017.10 and 2017.75 (see labels on the right side outside the plot) under the stationary background hypothesis accounting for the uncertainties in the stellar proper motion and distance. The GPI astrometry (red points) is shown for comparison. For most of the data points, the uncertainties are smaller than the size of the symbols.
Current usage metrics show cumulative count of Article Views (full-text article views including HTML views, PDF and ePub downloads, according to the available data) and Abstracts Views on Vision4Press platform.
Data correspond to usage on the plateform after 2015. The current usage metrics is available 48-96 hours after online publication and is updated daily on week days.
Initial download of the metrics may take a while.