Free Access
Fig. 9
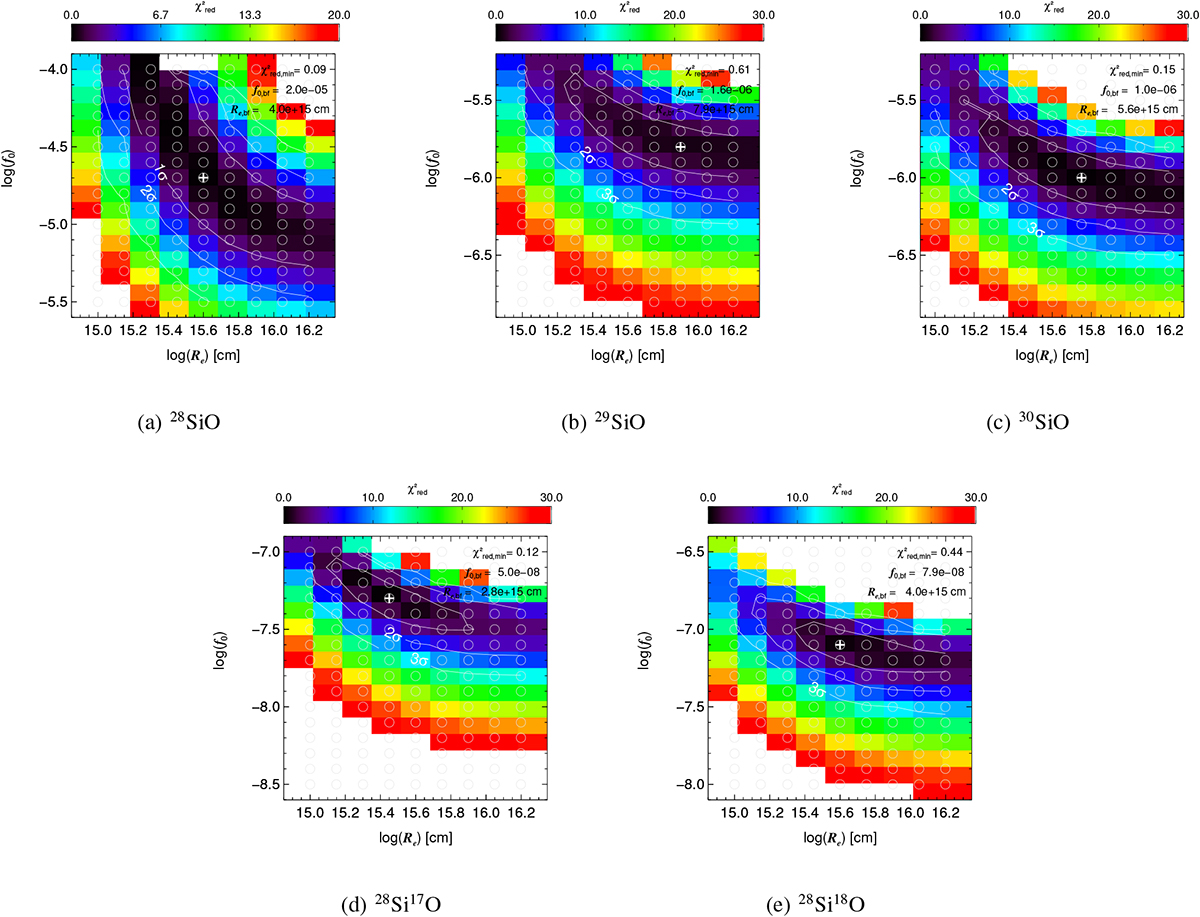
Reduced-χ2 maps of the model grids for the v = 0 state of five SiO isotopologues. Circles indicate the grid points and white crosses indicate the best-fit models. Contours are given at the ~68%, ~95%, and 99.7% confidence intervals (1σ, 2σ, and 3σ, respectively).
Current usage metrics show cumulative count of Article Views (full-text article views including HTML views, PDF and ePub downloads, according to the available data) and Abstracts Views on Vision4Press platform.
Data correspond to usage on the plateform after 2015. The current usage metrics is available 48-96 hours after online publication and is updated daily on week days.
Initial download of the metrics may take a while.