Free Access
Fig. A.1
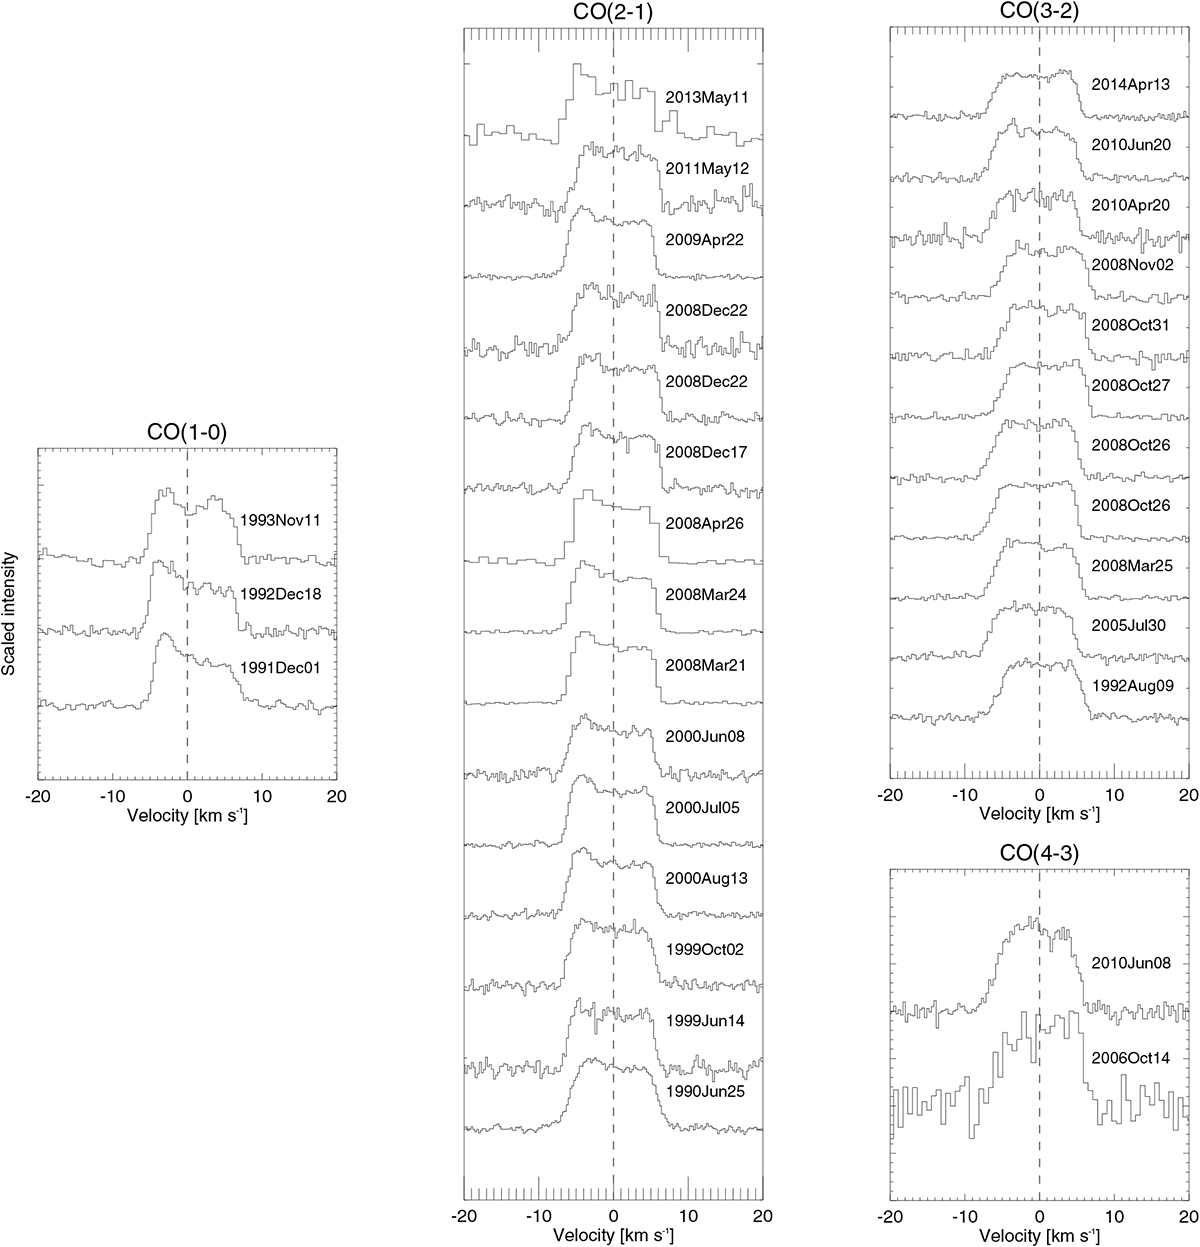
CO line emission from R Dor at different observing epochs: emission from J = 1–0, 2–1, 3–2 measured by SEST in 1990–2000, and from J = 2–1, 3–2, 4–3 by APEX in 2005–2014. The y-axis shows the line intensity at an arbitrary scale, chosen to optimise the visibility of the possible variations.
Current usage metrics show cumulative count of Article Views (full-text article views including HTML views, PDF and ePub downloads, according to the available data) and Abstracts Views on Vision4Press platform.
Data correspond to usage on the plateform after 2015. The current usage metrics is available 48-96 hours after online publication and is updated daily on week days.
Initial download of the metrics may take a while.