Fig. 21
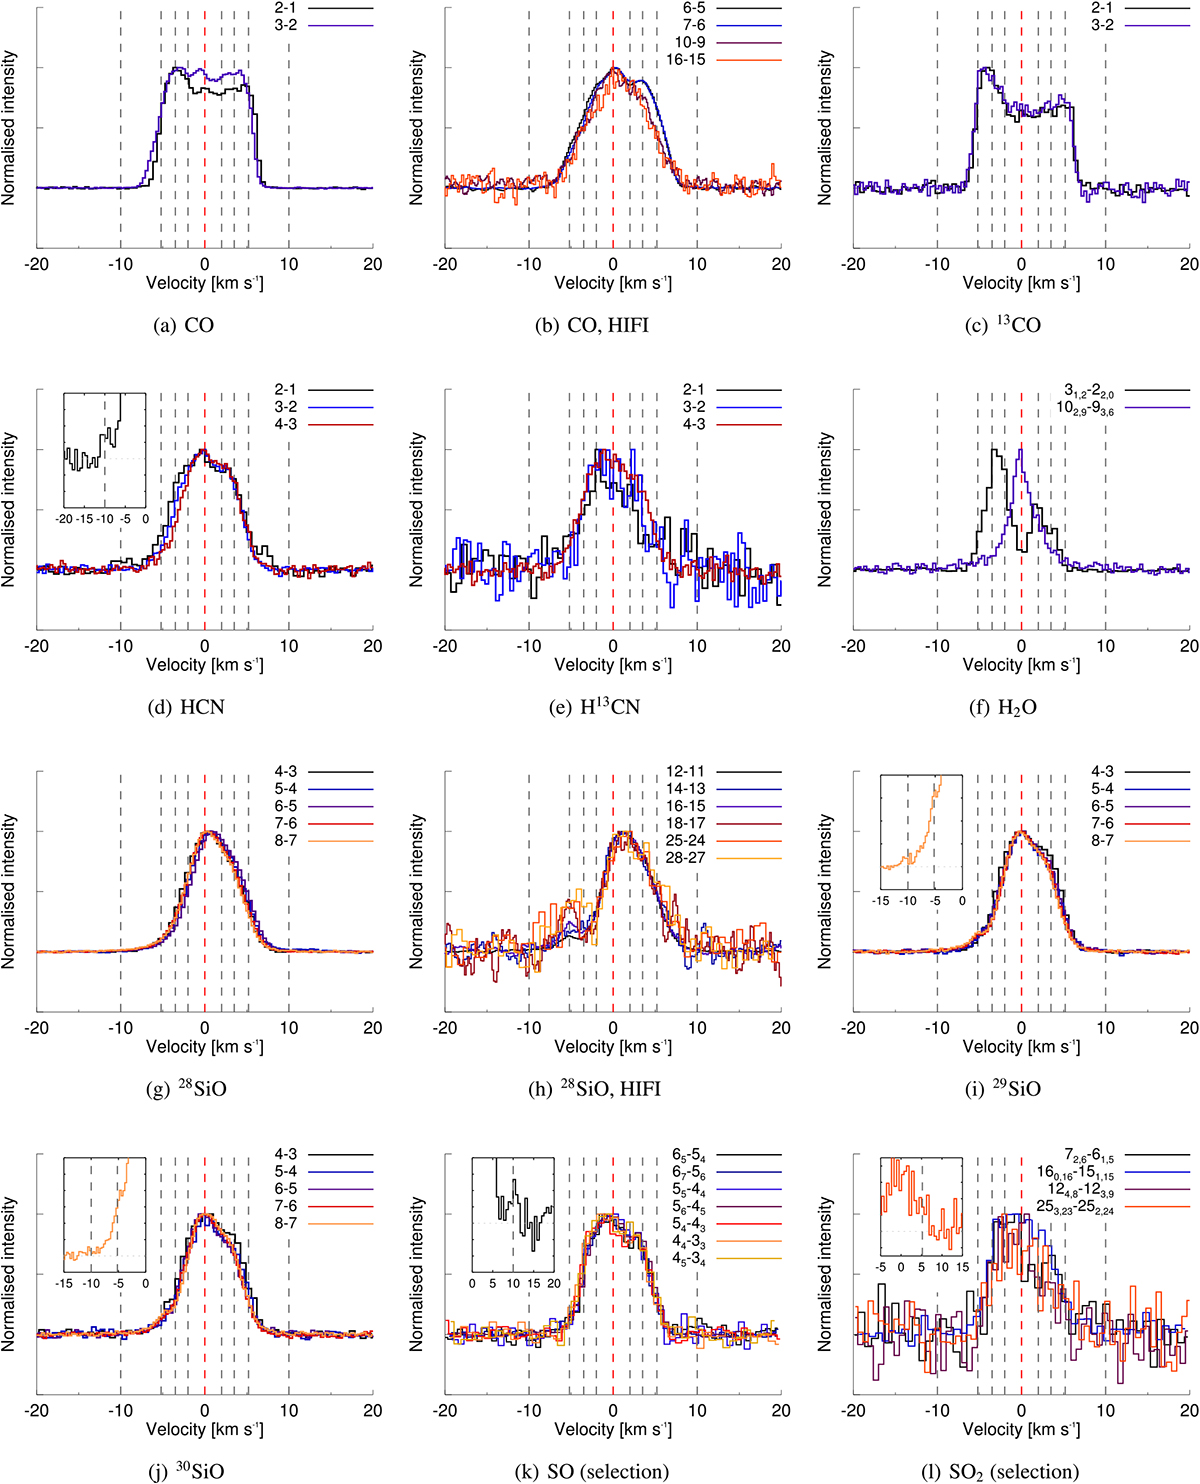
Line shapes. Vertical dashed lines correspond to velocities 0, ±2.0, ±3.5, and ±5.2 km s−1 with respect to the stellar vLSR, where distinct emission features appear in multiple of the presented lines. Insets (with the same colour coding as the main plots) are added to several of the panels for increased visibility of these substructures.
Current usage metrics show cumulative count of Article Views (full-text article views including HTML views, PDF and ePub downloads, according to the available data) and Abstracts Views on Vision4Press platform.
Data correspond to usage on the plateform after 2015. The current usage metrics is available 48-96 hours after online publication and is updated daily on week days.
Initial download of the metrics may take a while.