Fig. 20
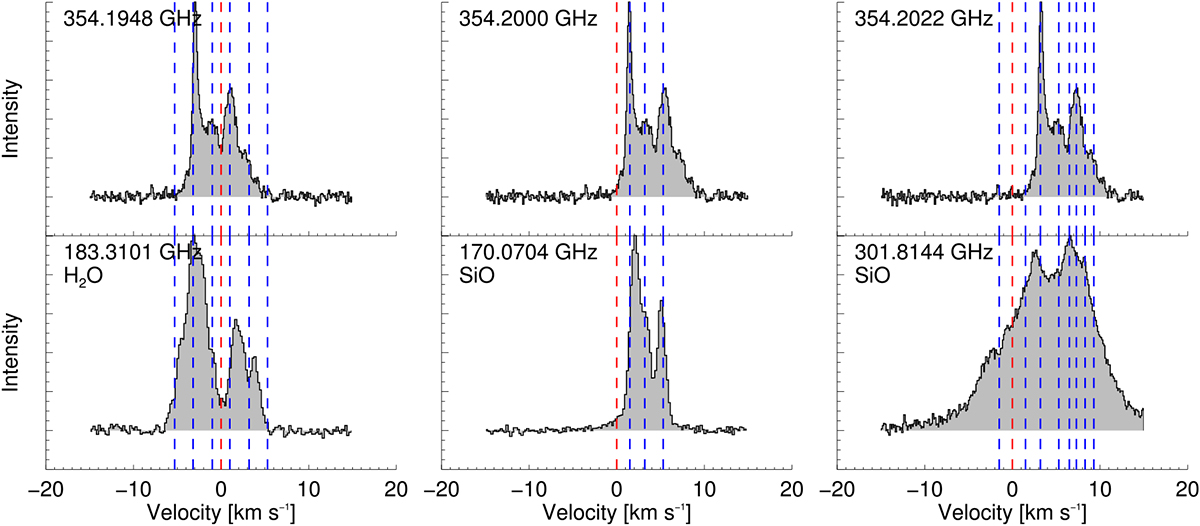
Alignment in velocity space of unidentified emission at ~354.2 GHz (top) with known maser emission (bottom). The spectra shown in the top panels, from left to right, assume rest frequencies of 354.1948, 354.2000, and 354.2022 GHz, respectively. The bottom panels show, from left to right, H2 O (![]() –22,0) at 183.3 GHz, SiO (v = 3, J = 4–3) at 170.1 GHz, and SiO (v = 1, J = 7–6) at 301.8 GHz. Vertical dashed lines indicate emission components similar to those mentioned in the discussion in Sect. 3.
–22,0) at 183.3 GHz, SiO (v = 3, J = 4–3) at 170.1 GHz, and SiO (v = 1, J = 7–6) at 301.8 GHz. Vertical dashed lines indicate emission components similar to those mentioned in the discussion in Sect. 3.
Current usage metrics show cumulative count of Article Views (full-text article views including HTML views, PDF and ePub downloads, according to the available data) and Abstracts Views on Vision4Press platform.
Data correspond to usage on the plateform after 2015. The current usage metrics is available 48-96 hours after online publication and is updated daily on week days.
Initial download of the metrics may take a while.