Fig. 19
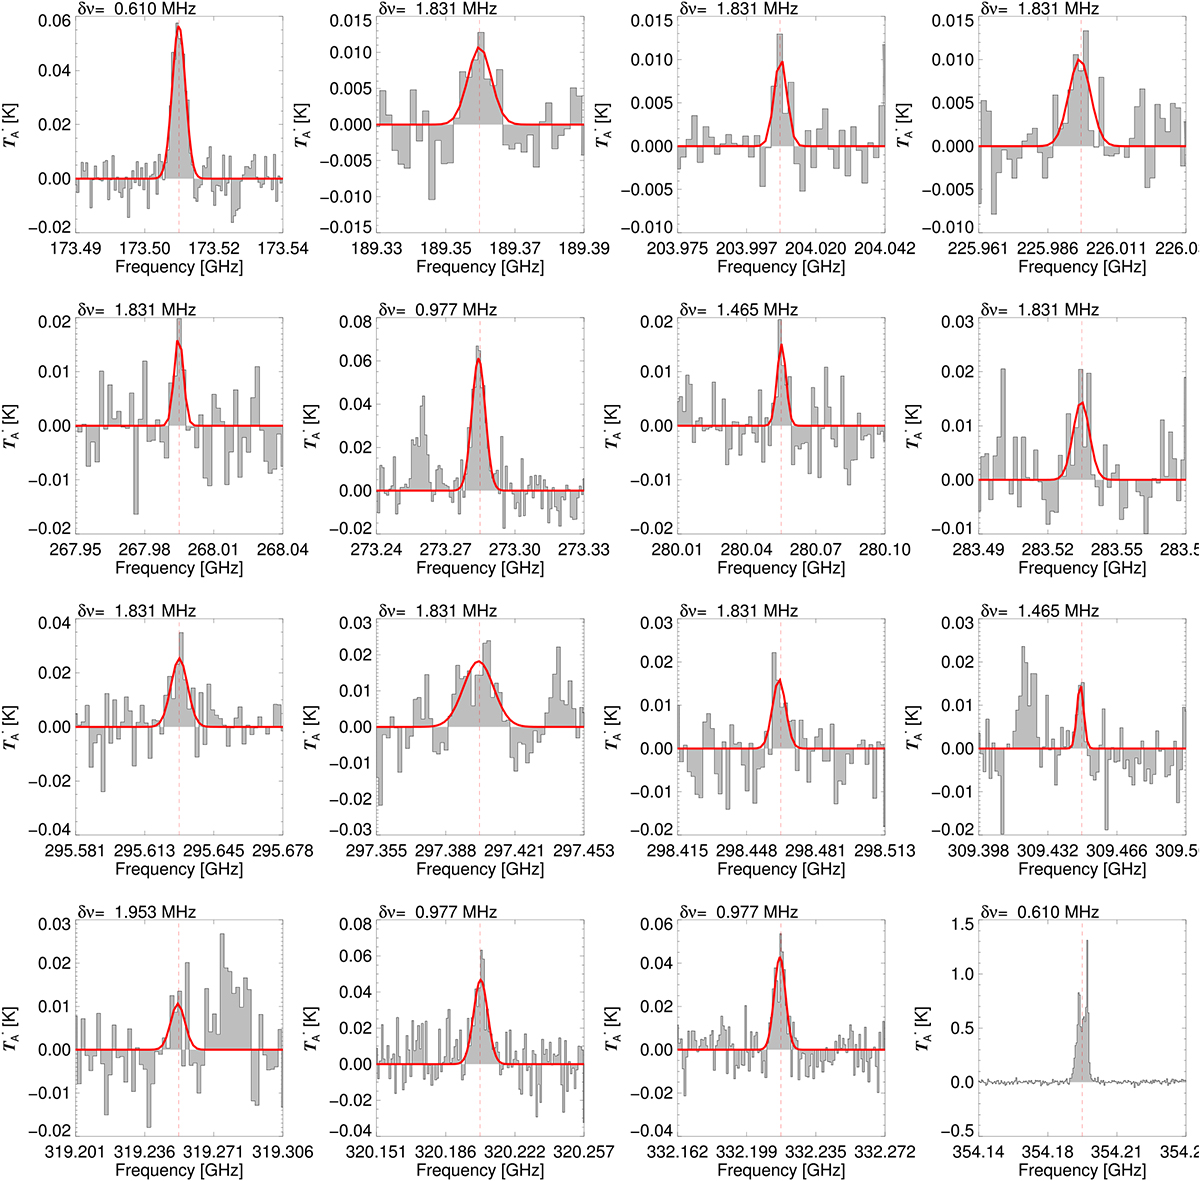
Unidentified line emission features. We fit a single Gaussian line profile to each of these, except the suspected maser line at 354 GHz, and list the retrieved central frequency, peak intensity, and FWHM at the given velocity resolution in Table 4. The corresponding frequency resolution δν of the spectra is given at the top left of each panel.
Current usage metrics show cumulative count of Article Views (full-text article views including HTML views, PDF and ePub downloads, according to the available data) and Abstracts Views on Vision4Press platform.
Data correspond to usage on the plateform after 2015. The current usage metrics is available 48-96 hours after online publication and is updated daily on week days.
Initial download of the metrics may take a while.