Fig. 18
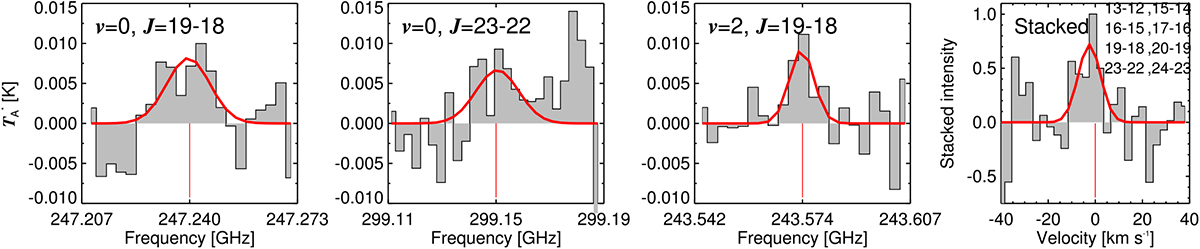
Tentative detection of NaCl line emission. The first three panels show tentative detections; for the v = 2, J = 19–18 spectrum, this is the combination of observations obtained at two different epochs (see text). The last panel shows a stacked spectrum using all rotational transitions (in v = 0) marked in the top right-hand corner.
Current usage metrics show cumulative count of Article Views (full-text article views including HTML views, PDF and ePub downloads, according to the available data) and Abstracts Views on Vision4Press platform.
Data correspond to usage on the plateform after 2015. The current usage metrics is available 48-96 hours after online publication and is updated daily on week days.
Initial download of the metrics may take a while.