Fig. 15
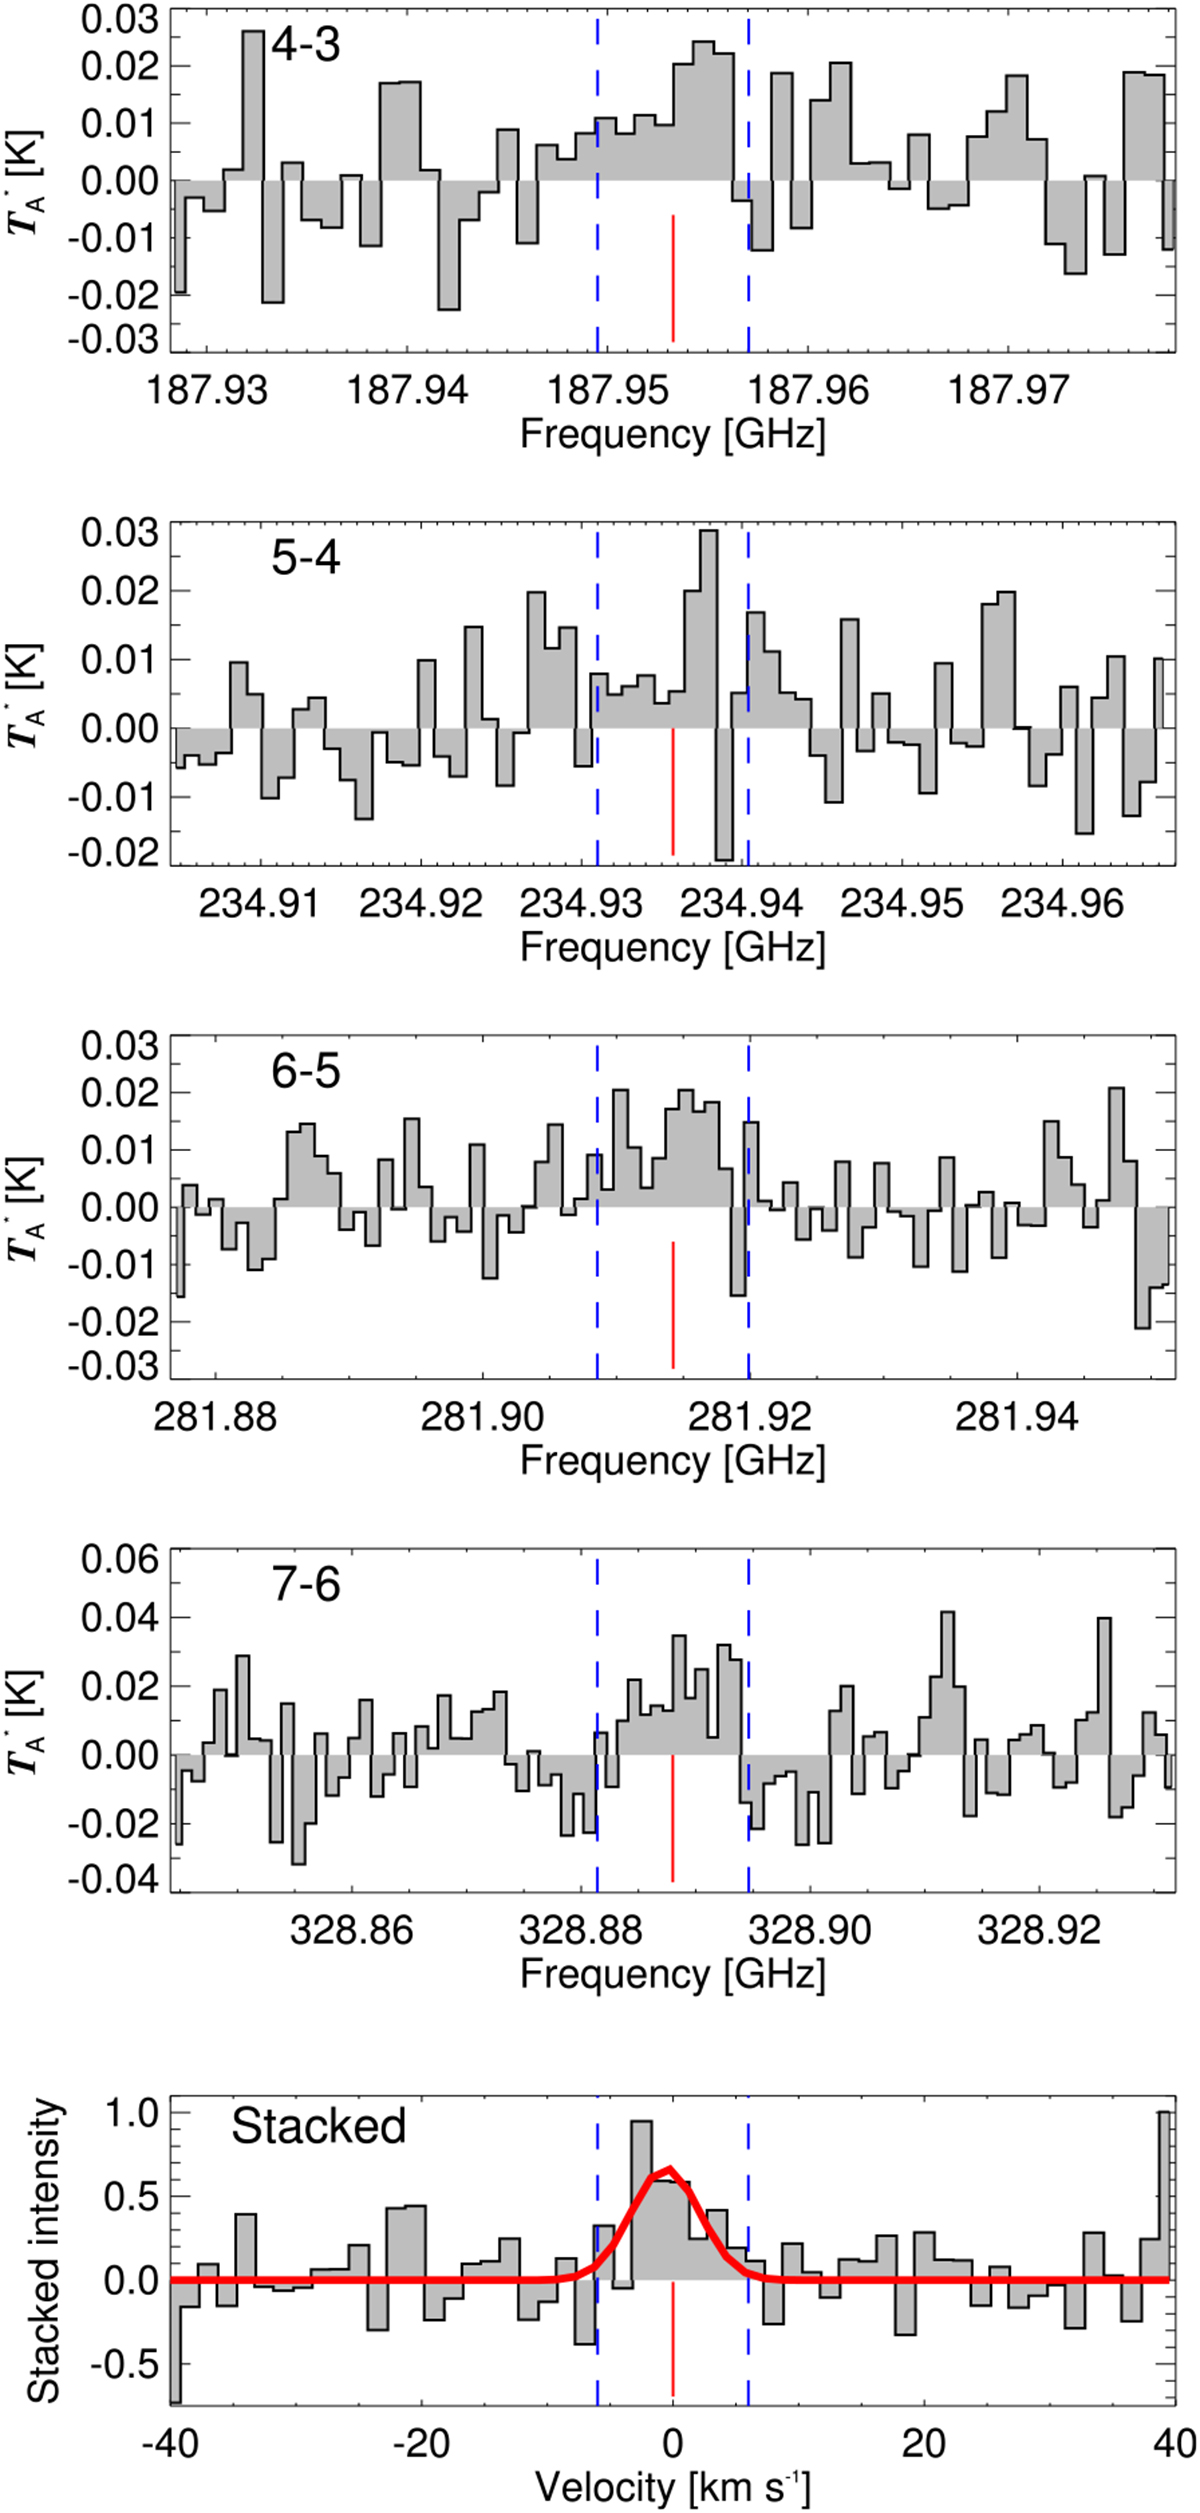
PN line emission. The first four panels show the spectra of the J = 4–3, …, 7–6 transitions;the bottom panel shows the peak-normalised result of stacking these at a velocity resolution of 1.5 km s−1, weighted with the upper level statistical weights, 2J + 1 of the respective transitions. Red lines indicate the rest frequency (or v = 0 km s−1 in the bottom panel) of each transition, blue lines indicate velocities ± 6 km s−1 with respect to the stellar vLSR. The red curve in the bottom panel represents a Gaussian fit to the stacked data.
Current usage metrics show cumulative count of Article Views (full-text article views including HTML views, PDF and ePub downloads, according to the available data) and Abstracts Views on Vision4Press platform.
Data correspond to usage on the plateform after 2015. The current usage metrics is available 48-96 hours after online publication and is updated daily on week days.
Initial download of the metrics may take a while.