Fig. 15
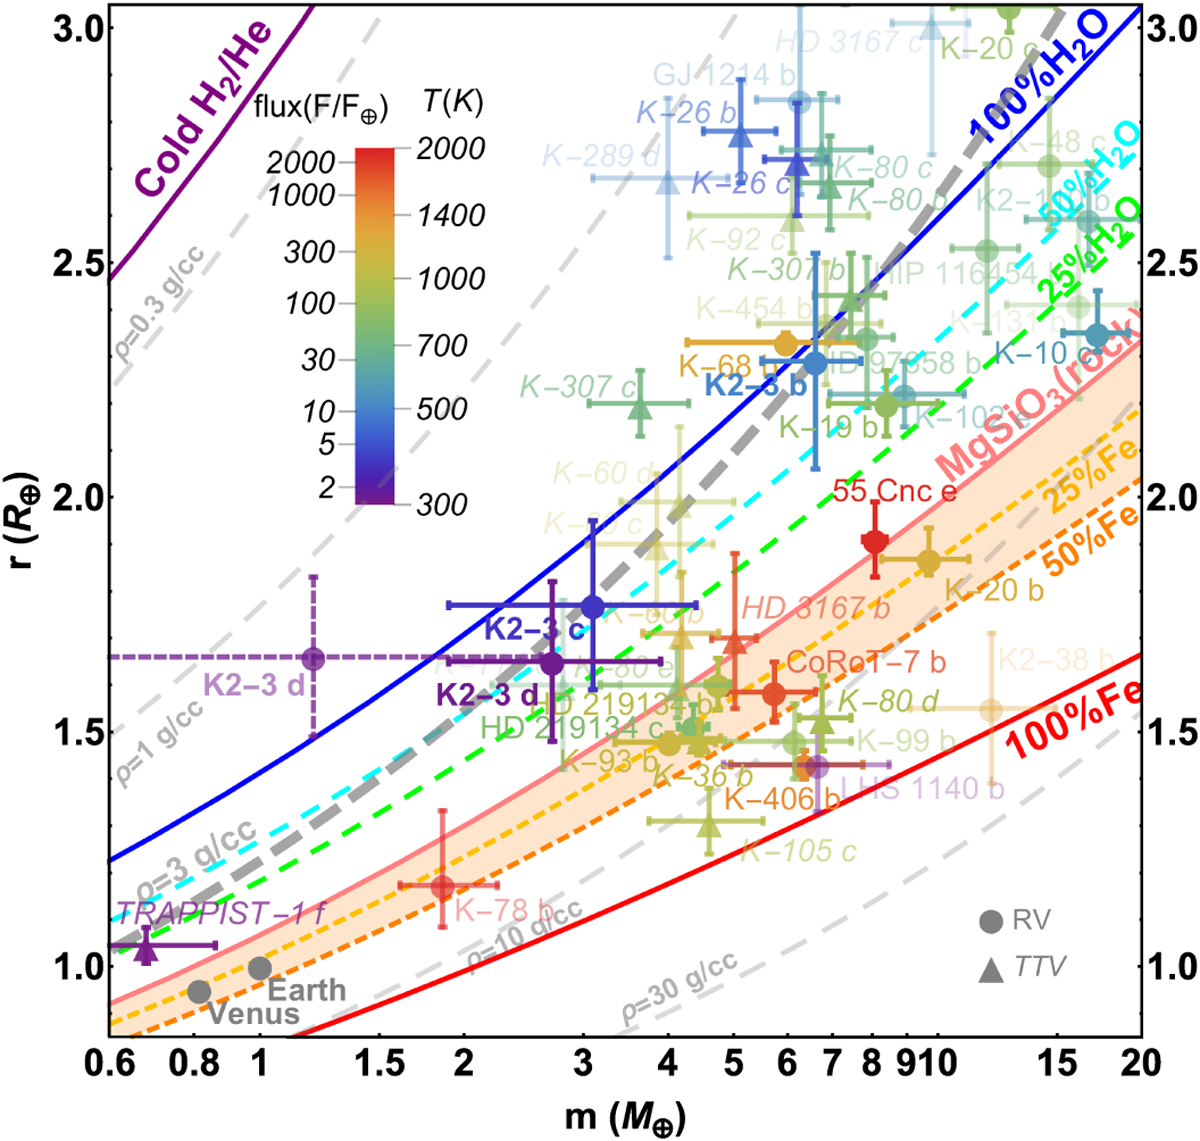
Mass-radius diagram for exoplanets for which the mass and radius have been both measured with a relative error better than 30%. The location of the K2-3 planets is emphasized. For K2-3 d we also plot the mass derived from the GP analysis (shaded point in violet), and the value corrected using the result of the simulations described in Sect. 5.1. The curve for bulk density ρ = 3 g cm-3 is shown in grey passing through the three positions occupied by the K2-3 planets. The planetary data are taken from the NASA exoplanet archive and updated to August 30, 2017.
Current usage metrics show cumulative count of Article Views (full-text article views including HTML views, PDF and ePub downloads, according to the available data) and Abstracts Views on Vision4Press platform.
Data correspond to usage on the plateform after 2015. The current usage metrics is available 48-96 hours after online publication and is updated daily on week days.
Initial download of the metrics may take a while.