Free Access
Fig. 14
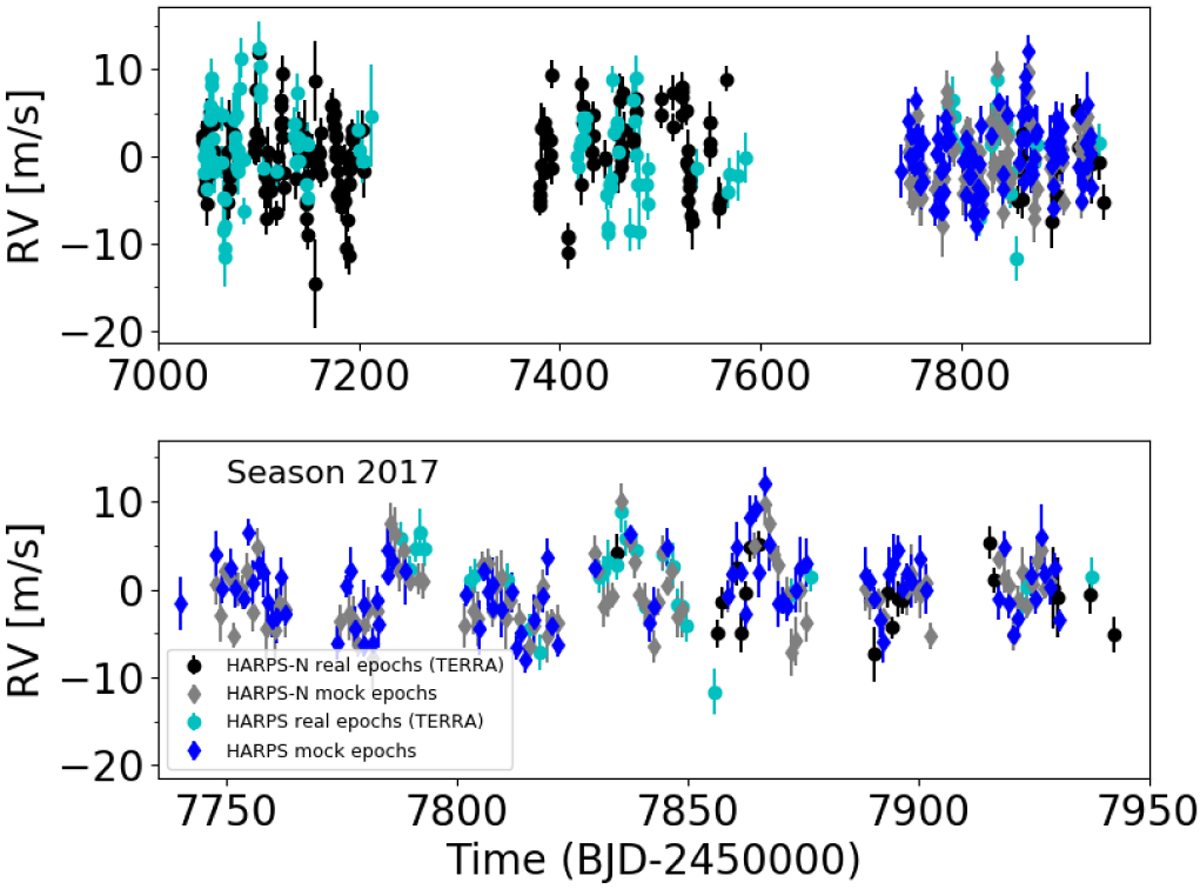
Example of a simulated RV dataset used to explore the effects on the characterization of the K2-3 planets of additional measurements taken over the 2017 season. The upper plot shows the complete mock dataset, while only the third seasonis shown in the second plot, to better appreciate the intensive simulated sampling.
Current usage metrics show cumulative count of Article Views (full-text article views including HTML views, PDF and ePub downloads, according to the available data) and Abstracts Views on Vision4Press platform.
Data correspond to usage on the plateform after 2015. The current usage metrics is available 48-96 hours after online publication and is updated daily on week days.
Initial download of the metrics may take a while.