Fig. 4
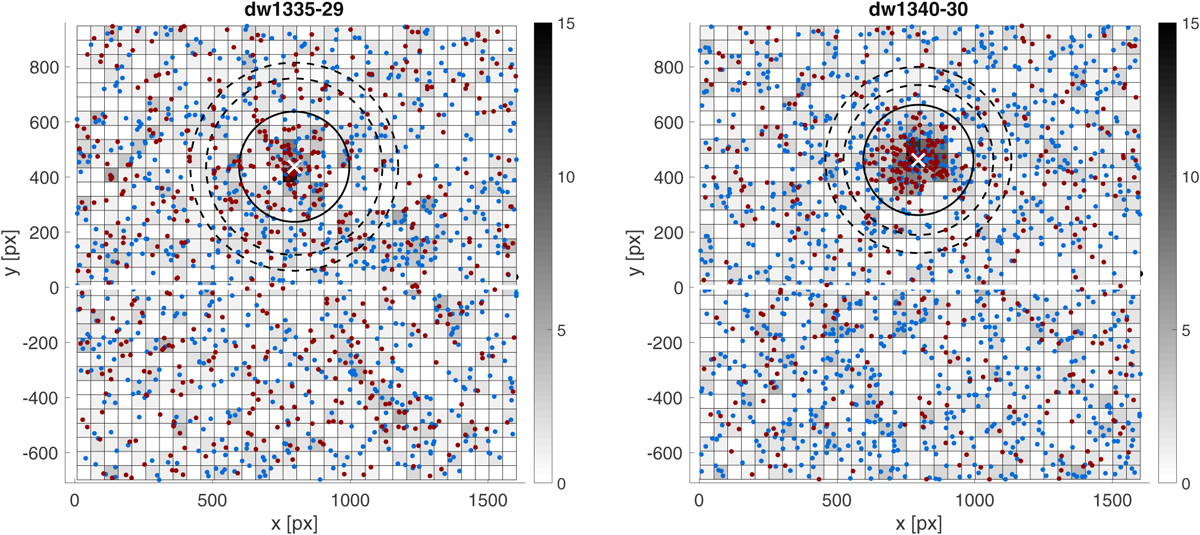
Distribution of stars (red and blue dots) with I-band magnitudes in the range 24–25.5, underlaid by a 2D histogram that represents the local star density (stars per 156 arcsec2). The cross marks the nominal center of the galaxy and the circle has a radius of 50′′ (=200 px). The left panels of Fig. 6 shows the CMD of all stars detected within that radius. The two outer circles (dashed lines) define an annulus with the same area as the inner circle. This area is used for statistical decontamination of the CMDs, and the annulus has the inner radius at the location corresponding to four times the effective radius (Müller et al. 2015) of the corresponding galaxy. Stars in the annulus were used to construct the CMD of Galactic foreground stars in the direction of the dwarf galaxy.
Current usage metrics show cumulative count of Article Views (full-text article views including HTML views, PDF and ePub downloads, according to the available data) and Abstracts Views on Vision4Press platform.
Data correspond to usage on the plateform after 2015. The current usage metrics is available 48-96 hours after online publication and is updated daily on week days.
Initial download of the metrics may take a while.