Fig. 3
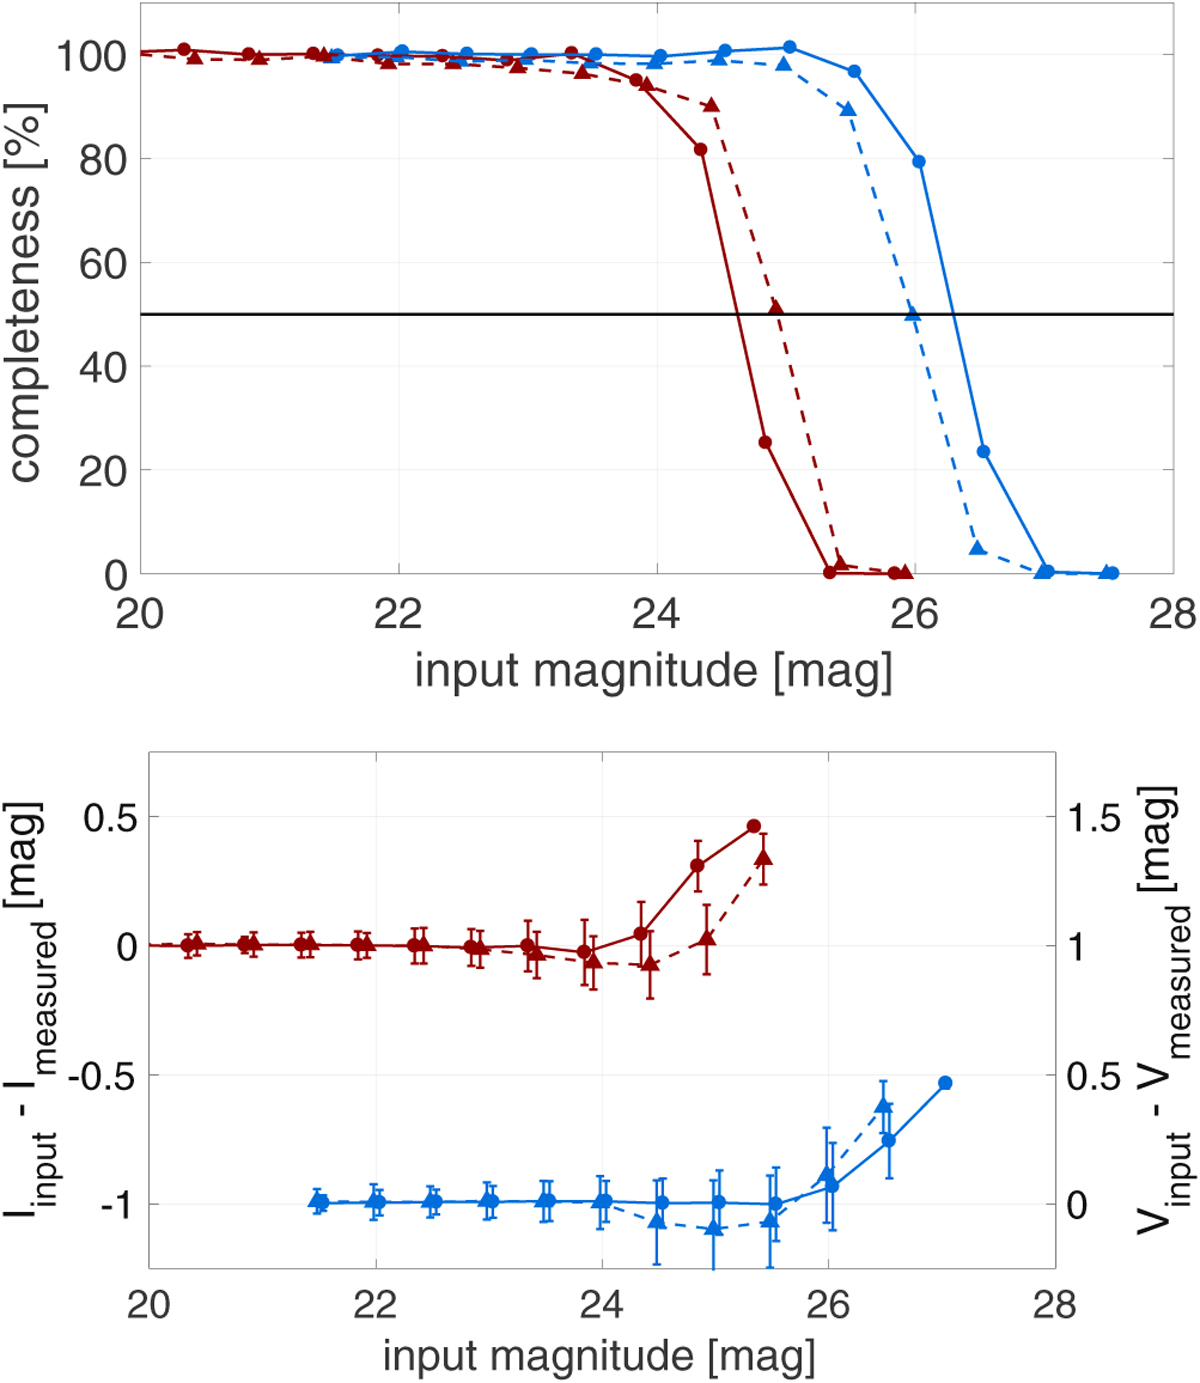
Results of our artificial star tests for I (red) and V (blue) bands(circles and straight line for dw1335-29, triangles and dashed line for dw1340-30). Upper panel: recovery rate of the artificial stars induced into the science frames as a function of the input magnitude. The 50% level is highlighted with the black horizontal line. Bottom panel: difference between the input magnitude and measured magnitude as a function of input magnitude.
Current usage metrics show cumulative count of Article Views (full-text article views including HTML views, PDF and ePub downloads, according to the available data) and Abstracts Views on Vision4Press platform.
Data correspond to usage on the plateform after 2015. The current usage metrics is available 48-96 hours after online publication and is updated daily on week days.
Initial download of the metrics may take a while.