Fig. 1
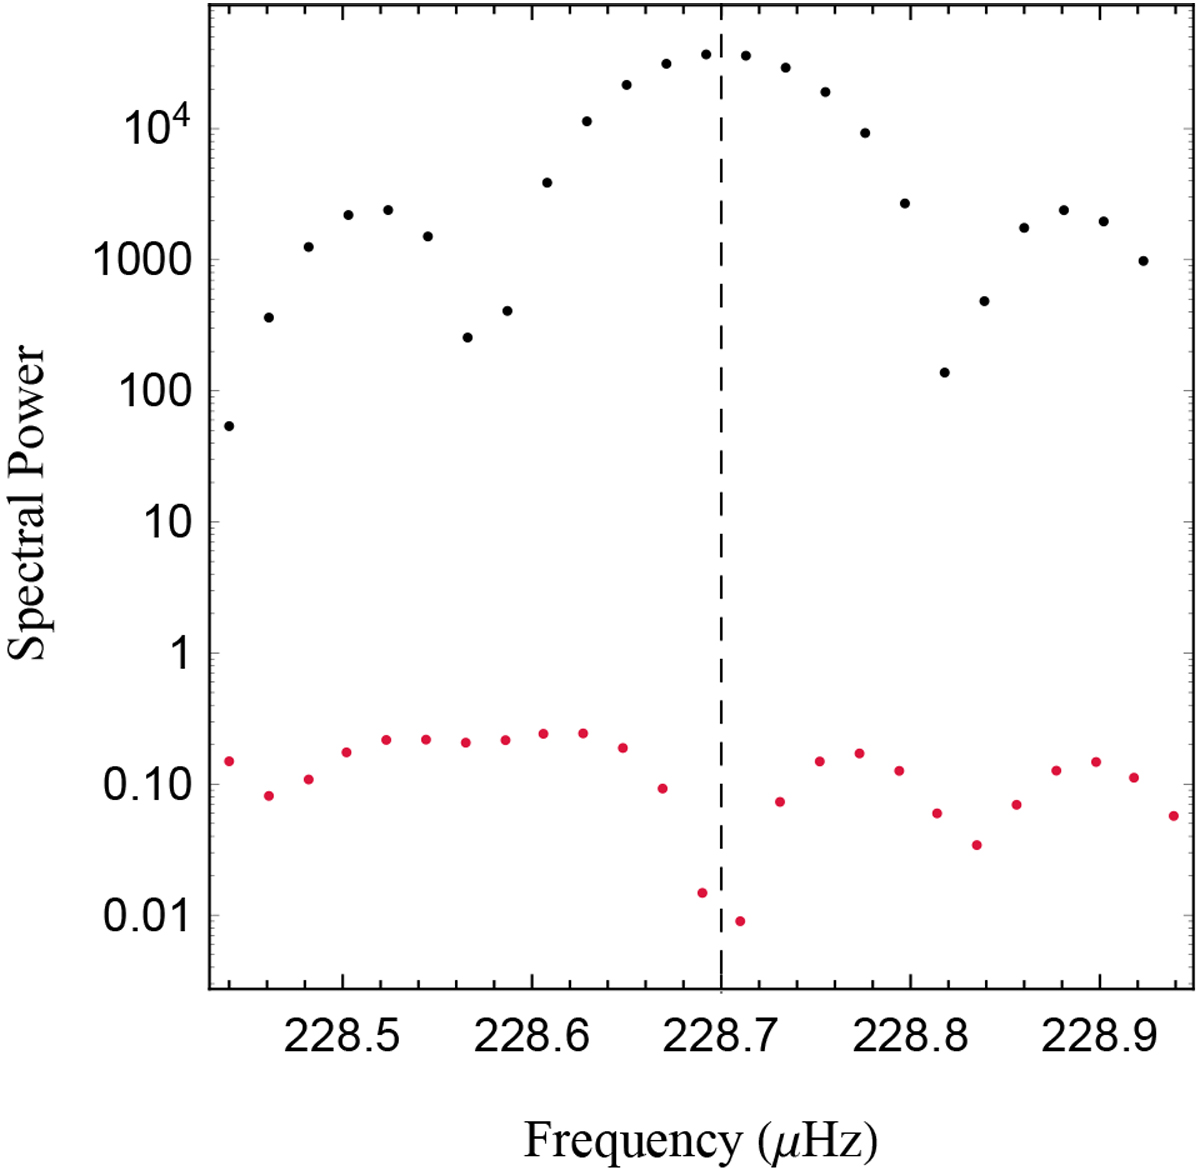
A periodogram window for the highest-amplitude peak in the synthetic time series discussed in Sect. 3.1. We set LASR to sample the spectral power of this peak 25 times. The black and red points show the Pi (ω) before and after LASR minimized the peak’s significance. The unreduced oscillation shows a clear peak with aliasing on either side. The dashed line marks the true frequency of this oscillation. LASR successfully reduces this oscillation and yields correct measurements of its (w, A, δ) values (see Table 2).
Current usage metrics show cumulative count of Article Views (full-text article views including HTML views, PDF and ePub downloads, according to the available data) and Abstracts Views on Vision4Press platform.
Data correspond to usage on the plateform after 2015. The current usage metrics is available 48-96 hours after online publication and is updated daily on week days.
Initial download of the metrics may take a while.