Fig. 8
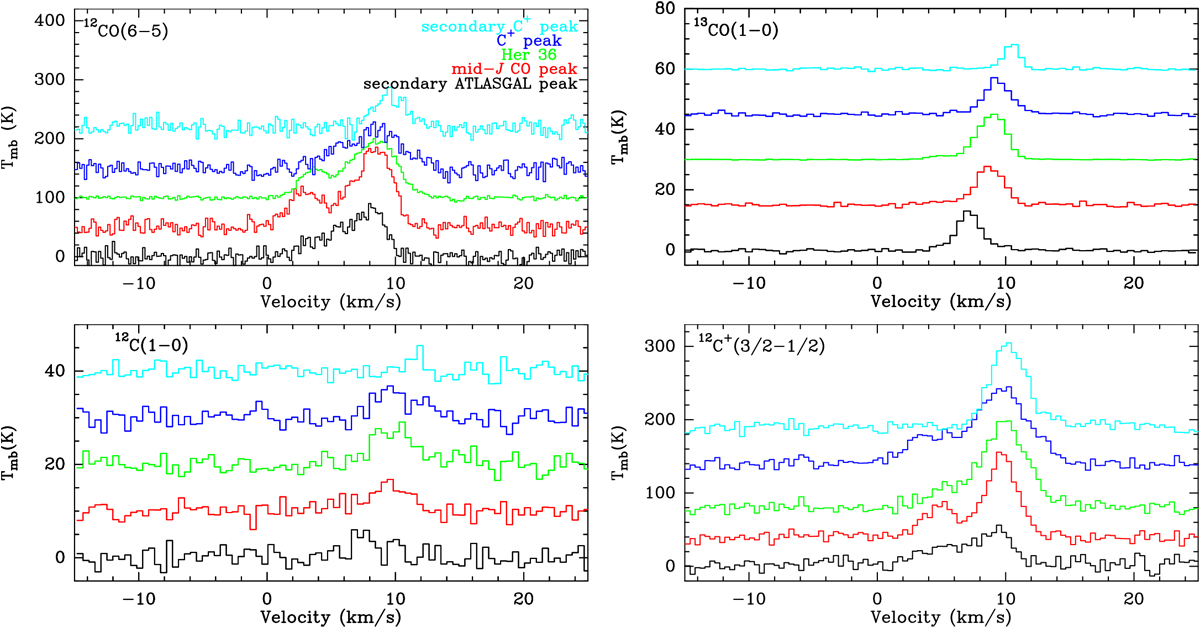
Line profiles at different offsets (′′) relative to Her 36 are shown in different colors at five positions mentioned in the upper left plot. For the detailed positions, see Sect. 3.5. Upper panels: J = 6 → 5 12CO and J = 1 → 0 13CO spectra; lower panels: 3P1 → 3P0 and 2 P3∕2 → 2P1∕2transitions of [C I] and [C II]. All spectra were extracted from their original beam sizes as mentioned in Table 1.
Current usage metrics show cumulative count of Article Views (full-text article views including HTML views, PDF and ePub downloads, according to the available data) and Abstracts Views on Vision4Press platform.
Data correspond to usage on the plateform after 2015. The current usage metrics is available 48-96 hours after online publication and is updated daily on week days.
Initial download of the metrics may take a while.