Fig. 7
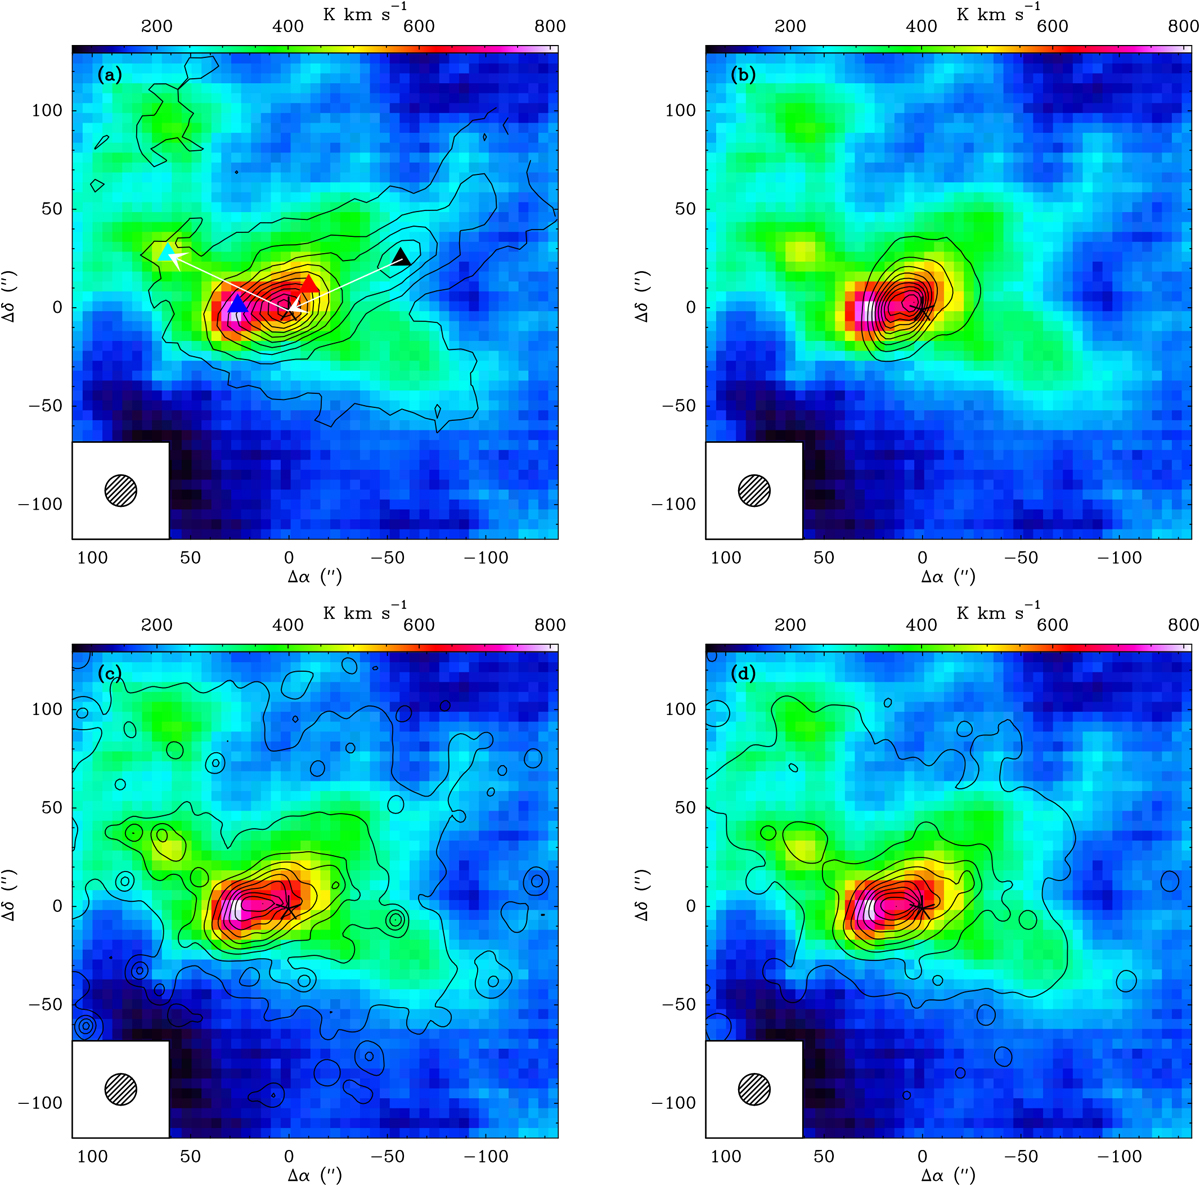
A [C II] velocity integrated intensity map overlaid with contours of (a) ATLASGAL870 μm continuumemission. Important offset positions discussed in the text are indicated with triangles of different colors: black represents the secondary ATLASGAL peak deep inside the molecular cloud at (Δ α = −53.0′′, Δ δ =23.0′′), red represents the emission peak of mid-J transitions of 12CO and 13CO at (Δα = −13.0′′, Δ δ =8.0′′), blue represents the peak of the [C II] 158 μm emission at (Δα =30.0′′, Δ δ = −2.0′′), and light blue represents the clump to the east of Her 36 observed in the channel maps of [C II] at (Δ α =60.0′′, Δ δ =27.0′′). The white arrows point along the molecular cloud in the west to the HII regions in the east of Her 36; (b) VLA 1.3 cm free-free continuum emission; (c) WISE 3.4 μm, and (d) WISE 4.6 μm mid-infrared continuum. Her 36 is the central position denoted with an asterisk. The contour levels are 5% to 95% in steps of 10% of the peak emission for (a) and 10% to 100% in steps of 10% of the peak emission for (b), (c), and (d).
Current usage metrics show cumulative count of Article Views (full-text article views including HTML views, PDF and ePub downloads, according to the available data) and Abstracts Views on Vision4Press platform.
Data correspond to usage on the plateform after 2015. The current usage metrics is available 48-96 hours after online publication and is updated daily on week days.
Initial download of the metrics may take a while.