Fig. 6
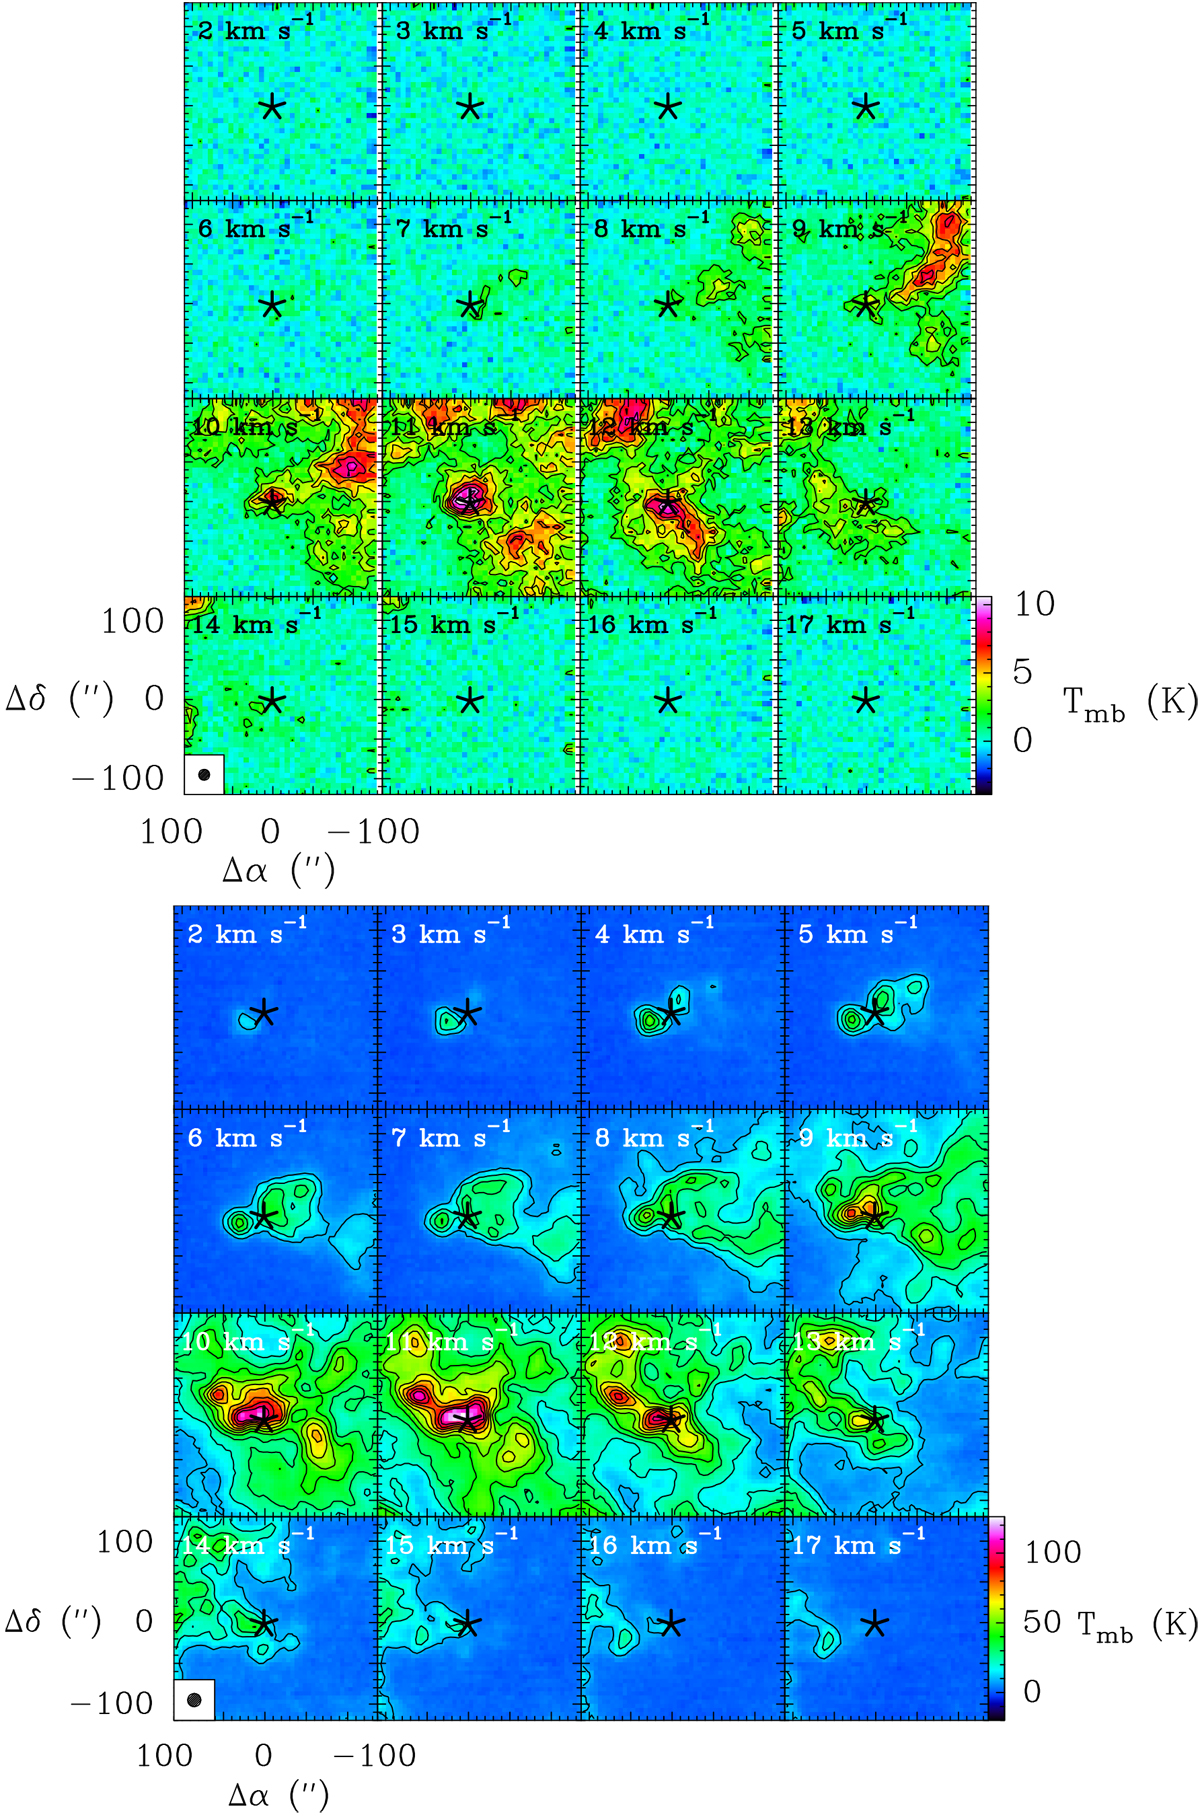
Velocity channel maps of the 3P1 → 3P0 transition of [C I] (upper 16 panels) and the 2P3∕2 → 2P1∕2 transition of [C II] (lower 16 panels) in a range of 2–17 km s−1 with a channel width of 1 km s−1 toward Her 36, which is the central position (Δα = 0, Δ δ = 0) at RA(J2000) = 18h03m40.3s and Dec(J2000) = −24°22′43′′, denoted with a black asterisk. The contour levels of [C I] are 3 × rms in steps of 2 × rms, while those of [C II] are from 10% (>3 × rms) to 100% in steps of 10% of the corresponding peak emission. All maps are plotted using original beam sizes shown in the lower left of both panels.
Current usage metrics show cumulative count of Article Views (full-text article views including HTML views, PDF and ePub downloads, according to the available data) and Abstracts Views on Vision4Press platform.
Data correspond to usage on the plateform after 2015. The current usage metrics is available 48-96 hours after online publication and is updated daily on week days.
Initial download of the metrics may take a while.