Free Access
Fig. 5
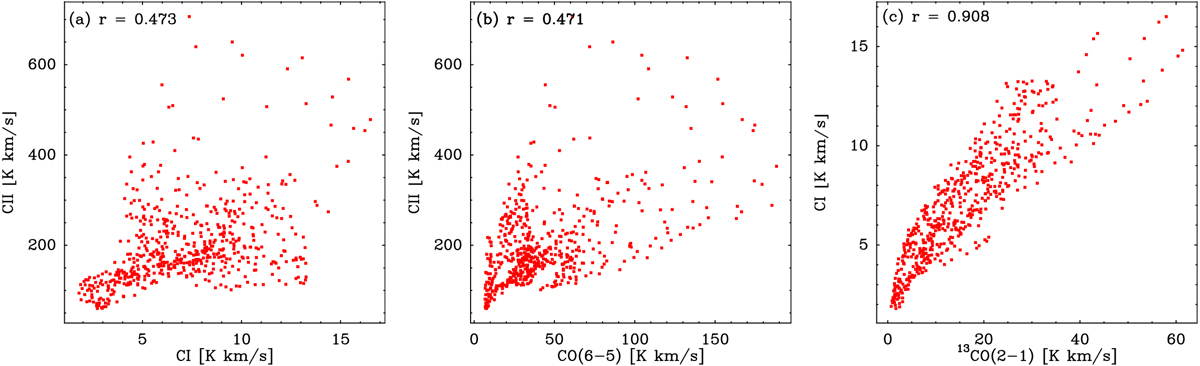
Scatter plots and correlation coefficients r between the velocity integrated intensity of (a) [C II] and [C I] (b) [C II] and the J = 6 → 5 transition of 12CO, and (c) [C I] and the J = 2 → 1 transition of 13CO. All data points were extracted from velocity integrated intensity maps convolved to the same beam size of 31′′.
Current usage metrics show cumulative count of Article Views (full-text article views including HTML views, PDF and ePub downloads, according to the available data) and Abstracts Views on Vision4Press platform.
Data correspond to usage on the plateform after 2015. The current usage metrics is available 48-96 hours after online publication and is updated daily on week days.
Initial download of the metrics may take a while.