Fig. 3
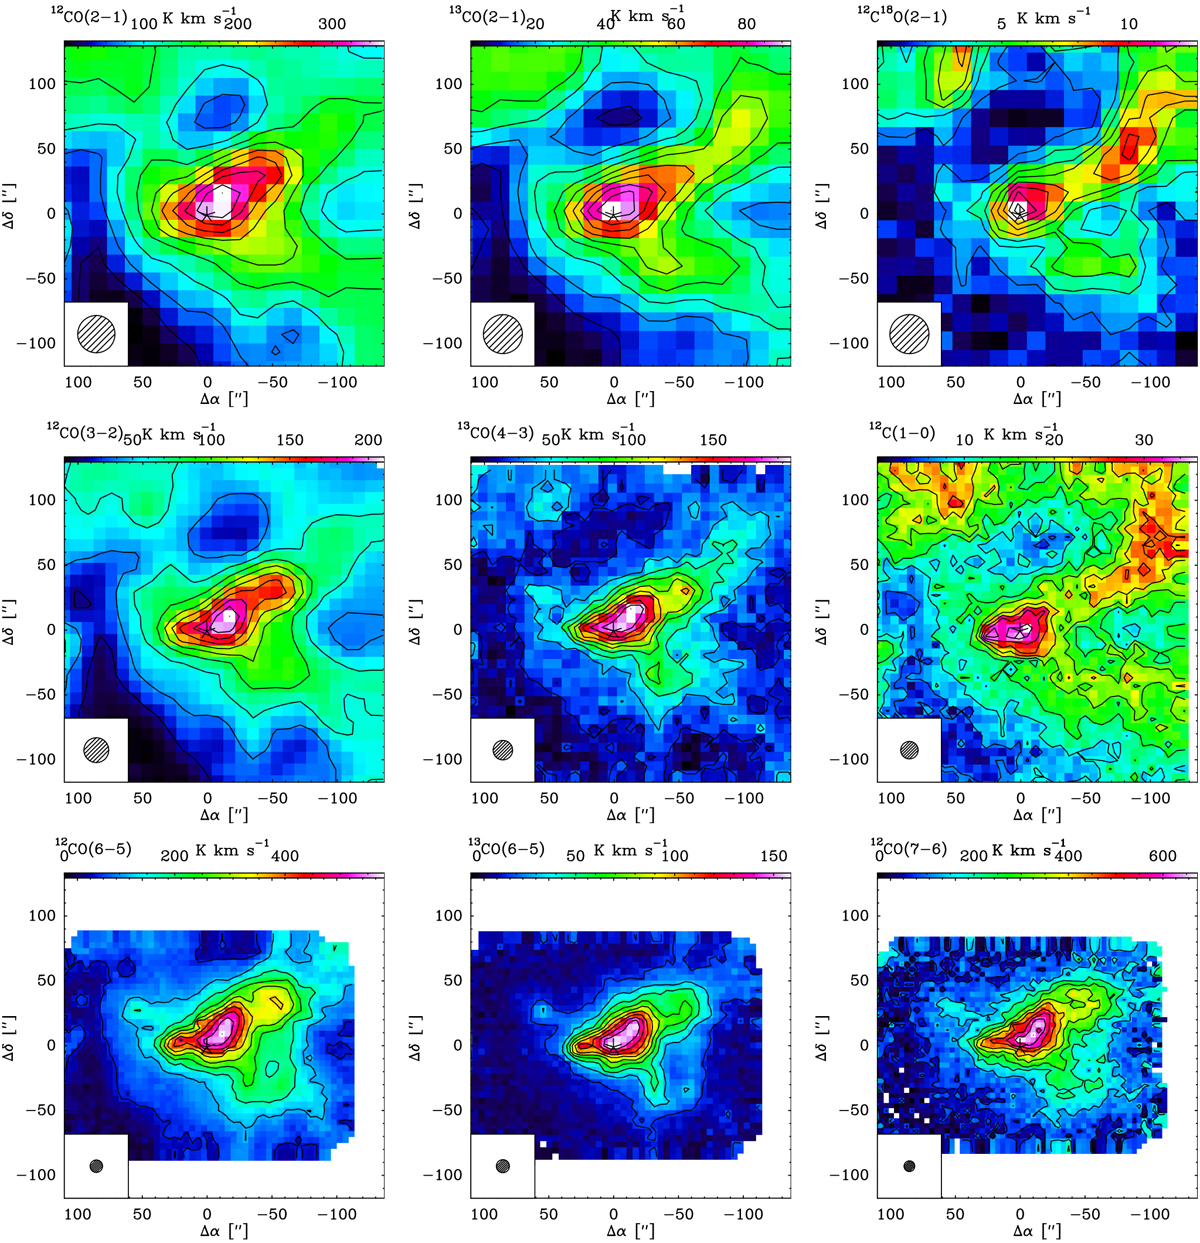
Colour maps of the integrated intensity of the J = 2 → 1, J = 3 →2, J = 6 →5, and J = 7 → 6 transitions of 12CO, the J = 2 → 1, J = 4 →3, and J = 6 → 5 transitions of 13CO, the J = 2 → 1 line of C18O and [C I] 1 → 0 toward Her 36. This corresponds to the central position (Δα = 0, Δ δ = 0) at RA(J2000) = 18h03m40.3s and Dec(J2000) = −24°22′43′′, denoted with an asterisk. The contour levels of 12C18O and [C I] are 3 × rms in steps of 2 × rms, while those of other molecules are from 10% (>3 × rms, given in Table 1) to 100% in steps of 10% of the corresponding peak emission given in Table 1. All maps are plotted using original beam sizes shown in the lower left of each map.
Current usage metrics show cumulative count of Article Views (full-text article views including HTML views, PDF and ePub downloads, according to the available data) and Abstracts Views on Vision4Press platform.
Data correspond to usage on the plateform after 2015. The current usage metrics is available 48-96 hours after online publication and is updated daily on week days.
Initial download of the metrics may take a while.