Fig. 15
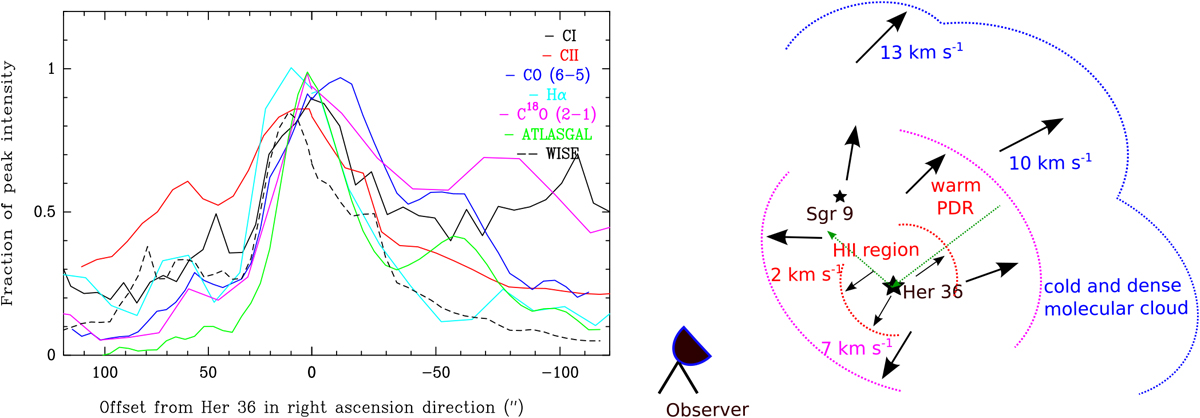
Left panel: velocity integrated intensities normalized to their value at peak vs. offset (′′) from Her 36 along the green arrows shown in the right. They follow a path from the second ATLASGAL peak at (−53′′, 23′′) to the second [C II] peak at (60′′, 27′′) via Her 36 at(0′′, 0′′). Plots are shown for [C II], [C I], J = 6 → 5 12 CO, J = 2 → 1 C18 O, Hα, ATLASGAL870 μm, and WISE 3.4 μm emission; right panel: schematic diagram of the prominent optical features of M8 pertinent to the discussion in this paper. The cold and dense molecular cloud is in the background shown in blue. The foreground gas of the warm PDR veil is receding away from Her 36 (~9 km s−1) with lower velocities (2–7 km s−1), while the HII region is powered by both stellar systems, Her 36 and 9 Sgr.
Current usage metrics show cumulative count of Article Views (full-text article views including HTML views, PDF and ePub downloads, according to the available data) and Abstracts Views on Vision4Press platform.
Data correspond to usage on the plateform after 2015. The current usage metrics is available 48-96 hours after online publication and is updated daily on week days.
Initial download of the metrics may take a while.