Fig. 13
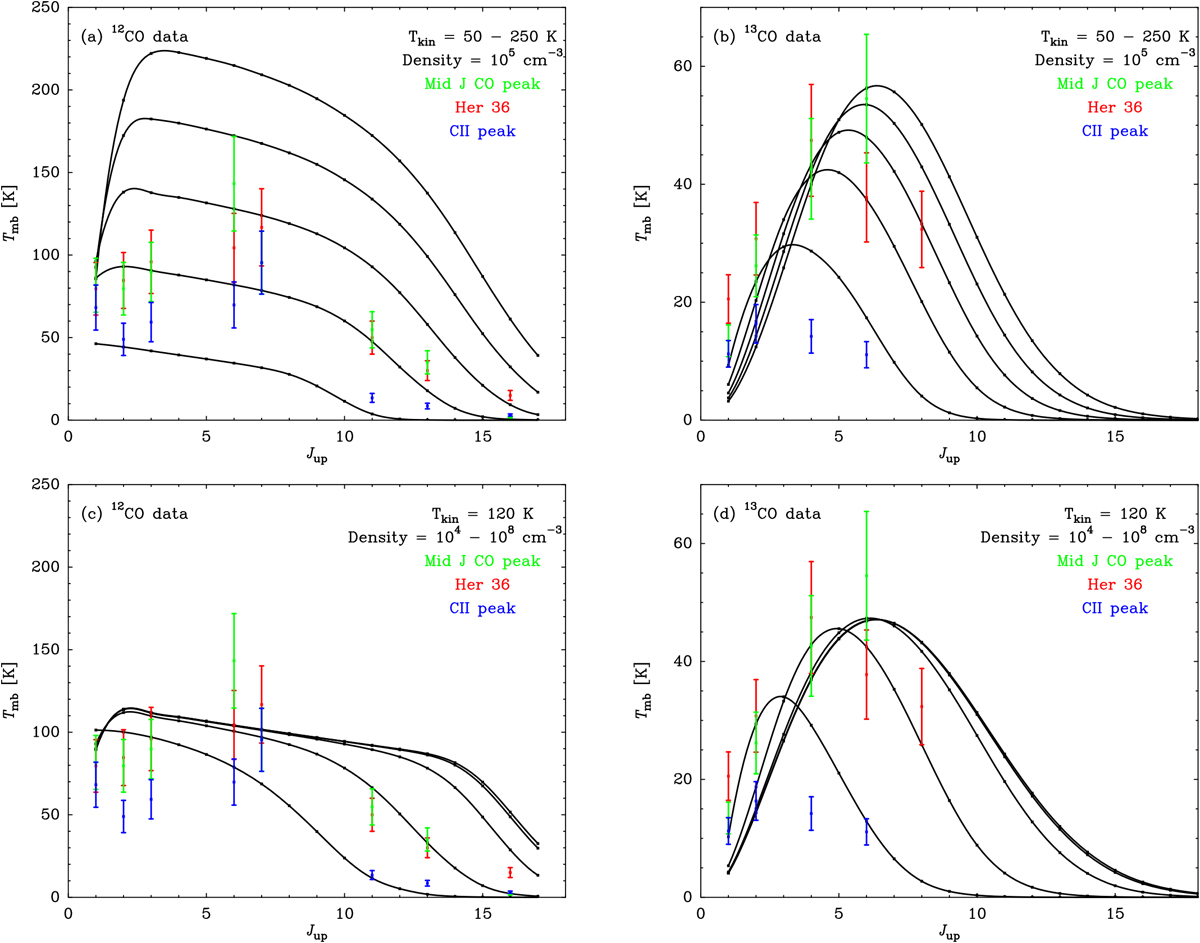
Results obtained from RADEX modeling for 12CO and 13CO at the mid-J CO peak (Δα = −13.0′′, Δ δ = 8.0′′), at Her 36 (Δα = 0′′, Δ δ = 0′′) and at the [C II] peak (Δα = 30.0′′, Δ δ = −2.0′′). Our observed data points are in green, red, and blue and are extracted from peak temperature maps convolved to the same resolution of 31′′. The column densities used in the modeling are for 12CO 4 × 1018 cm−2 and 8 × 1016 cm−2 for 13CO. Panels a and b: results obtained by varying the kinetic temperature from 50–250 K in steps of 50 K and keeping the density fixed at 105 cm–3; panels c and d: results obtained by varying the H2 density from 104–108 cm–3 in steps by a factor of 10 and keeping the kinetic temperature fixed at 120 K.
Current usage metrics show cumulative count of Article Views (full-text article views including HTML views, PDF and ePub downloads, according to the available data) and Abstracts Views on Vision4Press platform.
Data correspond to usage on the plateform after 2015. The current usage metrics is available 48-96 hours after online publication and is updated daily on week days.
Initial download of the metrics may take a while.