Fig. 12
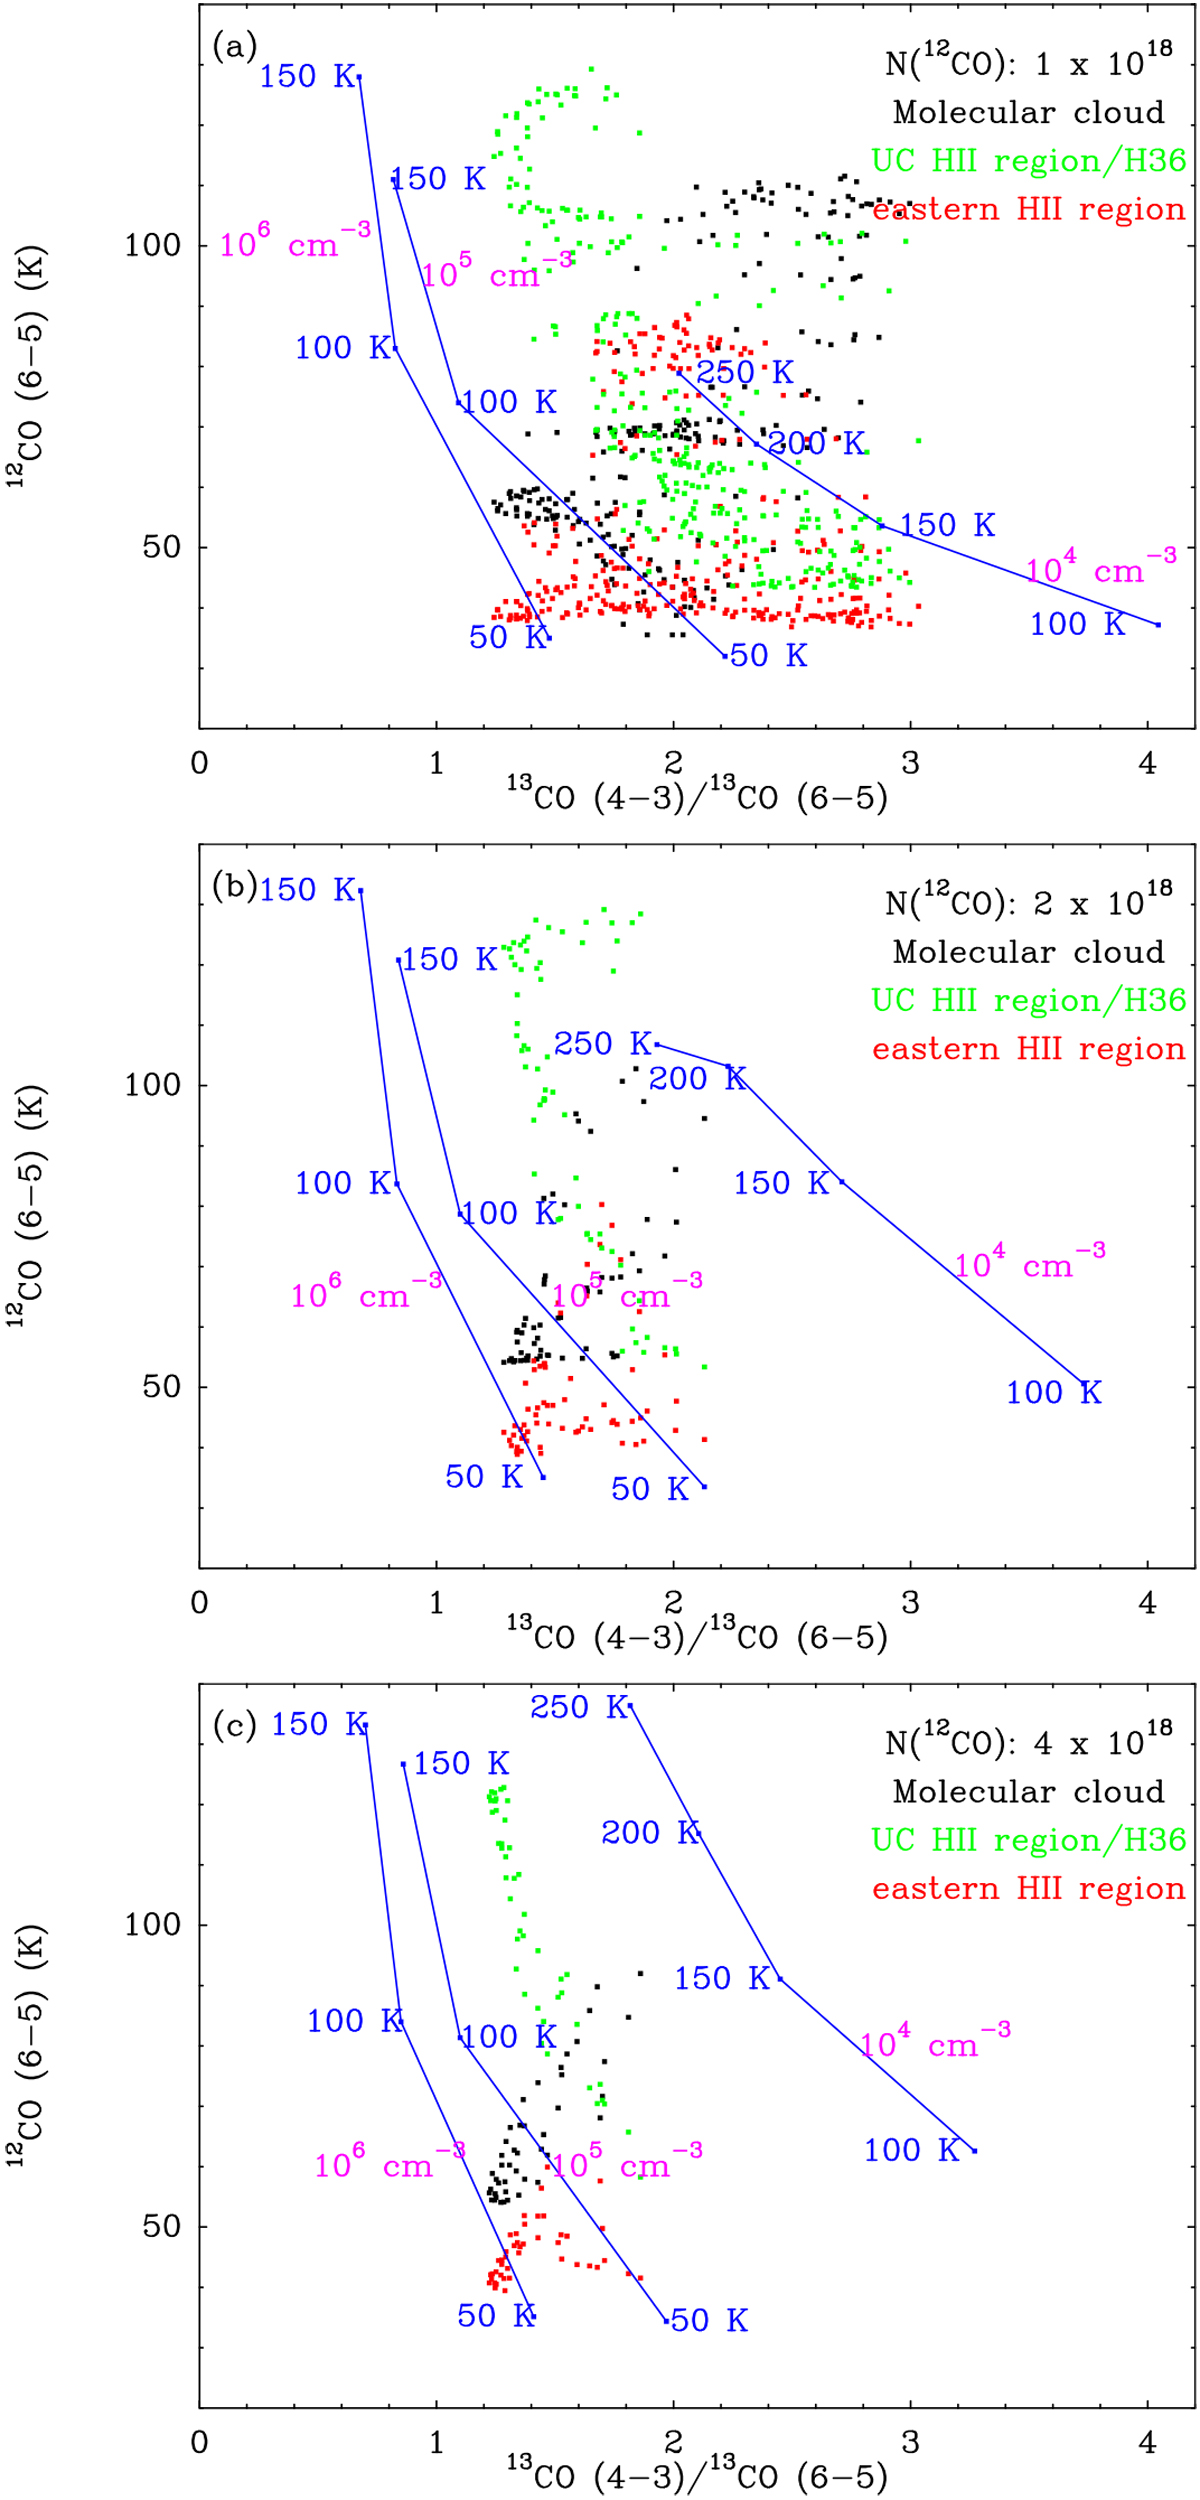
For 3 different 12CO column densities, RADEX modeling results are shown for 12CO J = 6 → 5 peak main-beam brightness temperatures and corresponding 13CO J = 4 → 3/13CO J = 6 → 5 ratios. The blue lines denote the RADEX modeling results for different kinetic temperatures at 3 different volume densities, and color points represent data from near the HII region, PDR, and molecular cloud (see Sect. 4.3). Each point denotes a 12CO J = 6 → 5 temperature and 13CO J = 4 → 3/13CO J = 6 → 5 temperature ratio obtained from a single pixel. Data points are extracted from peak temperature maps convolved to the same resolution of 16′′. (a) The data points plotted are obtained for a 12CO column density range of 8 × 10¹⁷ –1.8 × 1018 cm−2 and for modeling the chosen input 12CO column density is 1 × 1018 cm−2. (b) The data points plotted are obtained for a 12CO column density range of 1.8 × 10¹⁸ –3.5 × 1018 cm−2 and for the modeling the input 12CO column density is 2 × 1018 cm−2. (c) The data points plotted are obtained for a 12CO column density range of 3.5 × 10¹⁸ –5.1 × 1018 cm−2 and for the modeling input the 12CO column density is 4 × 1018 cm−2.
Current usage metrics show cumulative count of Article Views (full-text article views including HTML views, PDF and ePub downloads, according to the available data) and Abstracts Views on Vision4Press platform.
Data correspond to usage on the plateform after 2015. The current usage metrics is available 48-96 hours after online publication and is updated daily on week days.
Initial download of the metrics may take a while.