Fig. 10
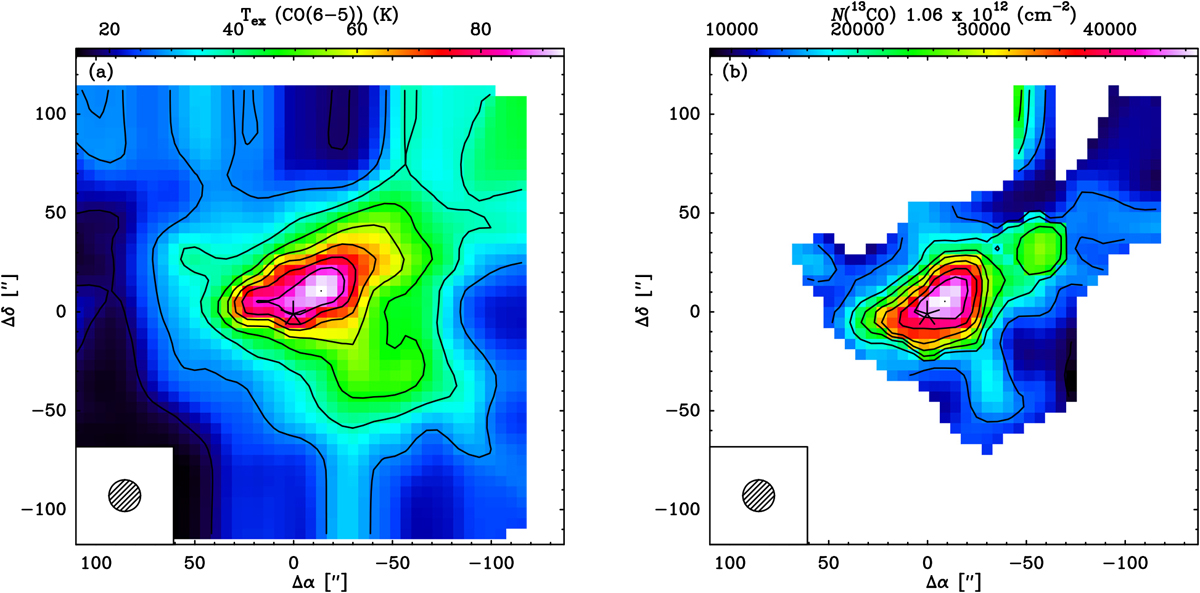
For the J = 6 → 5 transition (a) shows the excitation temperature of 12CO, which is assumed to be equal to that of 13CO and (b) shows the column density of 13CO. The asterisk represents Her 36, which is the central position (Δα = 0, Δ δ = 0) at RA(J2000) = 18h03m40.3s and Dec(J2000) = −24°22′43′′. The contour levels are 10% to 100% in steps of 10% of the corresponding peak emissions. All maps are plotted using original beam sizes shown in the lower left of each map.
Current usage metrics show cumulative count of Article Views (full-text article views including HTML views, PDF and ePub downloads, according to the available data) and Abstracts Views on Vision4Press platform.
Data correspond to usage on the plateform after 2015. The current usage metrics is available 48-96 hours after online publication and is updated daily on week days.
Initial download of the metrics may take a while.