| Issue |
A&A
Volume 615, July 2018
|
|
|---|---|---|
| Article Number | A91 | |
| Number of page(s) | 13 | |
| Section | Galactic structure, stellar clusters and populations | |
| DOI | https://doi.org/10.1051/0004-6361/201732428 | |
| Published online | 18 July 2018 | |
The origin of the first neutron star – neutron star merger
1
Nicolaus Copernicus Astronomical Center, Polish Academy of Sciences,
ul. Bartycka 18,
00-716
Warsaw,
Poland
e-mail: This email address is being protected from spambots. You need JavaScript enabled to view it.
2
Zentrum für Astronomie - Astronomisches Rechen-Institut,
Weberstrasse 13,
69120
Heidelberg,
Germany
3
Department of Astrophysics/IMAPP, Radboud University,
PO Box 9010,
6500
GL Nijmegen,
The Netherlands
4
Max-Planck-Institut für Astronomie,
Königstuhl 17,
69117
Heidelberg,
Germany
5
Center for Gravitational Wave Astronomy, University of Texas Rio Grande Valley,
Brownsville,
TX,
USA
6
National Astronomical Observatories of China, Chinese Academy of Sciences NAOC/CAS,
20A Datun Rd., Chaoyang District,
Beijing
100012,
PR China
7
National Astronomical Observatories, Chinese Academy of Sciences,
Beijing
100012,
PR China
8
School of Astronomy & Space Science, University of the Chinese Academy of Sciences,
Beijing
100012,
PR China
Received:
6
December
2017
Accepted:
28
March
2018
Abstract
The first neutron star-neutron star (NS-NS) merger was discovered on August 17, 2017 through gravitational waves (GW170817) and followed with electromagnetic observations. This merger was detected in an old elliptical galaxy with no recent star formation. We perform a suite of numerical calculations to understand the formation mechanism of this merger. We probe three leading formation mechanisms of double compact objects: classical isolated binary star evolution, dynamical evolution in globular clusters, and nuclear cluster formation to test whether they are likely to produce NS-NS mergers in old host galaxies. Our simulations with optimistic assumptions show current NS-NS merger rates at the level of 10−2 yr−1 from binary stars, 5 × 10⁻⁵ yr−1 from globular clusters, and 10−5 yr−1 from nuclear clusters for all local elliptical galaxies (within 100 Mpc3). These models are thus in tension with the detection of GW170817 with an observed rate of 1.5−1.2+3.2 yr−1 (per 100 Mpc3; LIGO/Virgo 90% credible limits). Our results imply that either the detection of GW170817 by LIGO/Virgo at their current sensitivity in an elliptical galaxy is a statistical coincidence; that physics in at least one of our three models is incomplete in the context of the evolution of stars that can form NS-NS mergers; or that another very efficient (unknown) formation channel with a long delay time between star formation and merger is at play.
Key words: gravitational waves
© ESO 2018
1 Introduction
Double compact objects (NS-NS: neutron star – neutron star systems; BH-NS: black hole – neutron star systems; BH-BH: black hole – black hole systems) are considered to form along two major formation channels: isolated binary evolution in galactic fields (Tutukov & Yungelson 1993; Lipunov et al. 1997; Voss & Tauris 2003; Belczynski et al. 2016; Stevenson et al. 2017) and dynamical evolution of stars in dense (e.g., globular) clusters (Portegies Zwart et al. 2004; Rodriguez et al. 2016b; Askar et al. 2017). Each of these channels has one major variation that can be treated as a separate formation channel: homogeneous (rapid rotation) stellar evolution for isolated binaries (Maeder 1987; Yoon & Langer 2005; de Mink et al. 2009) and nuclear cluster evolution of stars with dynamical interactions (Antonini & Rasio 2016; Hoang et al. 2017; Arca-Sedda & Capuzzo-Dolcetta 2017c). The homogeneous evolution is claimed to work only for very massive stars (≳30 M⊙; e.g., BH progenitors) and not for stars that can produce NSs (Yoon et al. 2006; Mandel & de Mink 2016; de Mink & Mandel 2016; Marchant et al. 2016; Eldridge & Stanway 2016; Woosley 2016) and therefore we do not consider this channel in the context of NS-NS formation.
For the remaining three channels (classical isolated binary evolution, globular cluster dynamics, and nuclear cluster dynamics) we perform estimates of the NS-NS merger rate. The estimates are carried out with a population synthesis method for the isolated binary channel, with a Monte Carlo code that combines dynamical interactions with population synthesis for the globular cluster channel, and with a semi-analytical extrapolation of globular cluster results to obtain an estimate for the nuclear cluster channel. Each estimate is self-consistent in its treatment of stellar evolution/dynamical evolution from star formation to NS-NS merger. However, the estimates are not fully consistent with each other as we choose different optimistic assumptions to increase the NS-NS merger rate within each channel. This allows us to independently assess the chance that GW170817 was formed along one of these channels, but it cannot serve as a comparison between channels.
Additionally, within each channel, we use only very limited knowledge of the effects of input physics on NS-NS merger rates. In the case of isolated binary evolution our choice of input physics is based on a study of about 20 models with varying assumptions on the commonenvelope, Roche lobe overflow (RLOF) mass and angular momentum loss, and natal kicks (Chruslinska et al. 2018). In the case of the dynamical channel, our choice of input physics is based on previous simulations of approximately 2000 globular cluster models with varying initial (mass, stellar density, and binarity) cluster parameters (Askar et al. 2017). In the case of the nuclear cluster channel, we test two major models of nuclear cluster formation in the context of NS-NS merger production. For each channel, we present only one model with specific input physics that tends to increase the NS-NS merger rate. The various models that provide the basis for our choice of input physics are only a small representation of existing possibilities within the multi-dimensional parameter space of uncertain evolutionary and dynamical parameters. Our main goal isto determine the highest attainable NS-NS merger rates with currently tested models and contrast them with the LIGO/Virgo detection. Future studies will hopefully gain extra momentum to test broad regions of parameter space if we can demonstrate here that LIGO/Virgo estimate of merger rate cannot be reproduced with the current set of models. This is all based on the assumption that LIGO/Virgo single detection is not a statistical coincidence.
For all three channels, as an input we need a star-forming mass that may have potentially contributed to the formation of GW170817 in an old host galaxy. Advanced LIGO/Virgo was sensitive to NS-NS mergers to ≲ 100 Mpc. The host of GW170817, NGC 4993, is an early-type galaxy with sub-solar metallicity and virtually no current star formation. The peak of star formation was estimated at ≳10 Gyr (with exponential decay afterwards; Blanchard et al. 2017), or last estimated to take place tsf =3–7 Gyr ago (Troja et al. 2017). For our “realistic” estimates, we assume all early-type galaxies within 100 Mpc3 around Earth formed all stars tsf = 5 Gyr ago. We also allow for two variations, one with tsf = 10 Gyr (“pessimistic”) and another with tsf = 1 Gyr (“optimistic”). Using the Illustris cosmological simulation we estimate the number of local (z = 0) elliptical galaxies to be Nell = 65 821 within 100 Mpc3. Stellar mass contained in these elliptical galaxies is Mell,tot = 1.1 × 10¹⁴ M⊙ (see Appendix A). The Illustris cosmological simulation shows a remarkably good agreement with the overall observed properties of galaxies at low redshift (Vogelsberger et al. 2014b). It also provides a good representation of the galaxy stellar mass function and the evolution of star formation across cosmic times (Genel et al. 2014) and a reasonable variety of galaxy morphology and colors (Snyder et al. 2015; Torrey et al. 2015). For all estimates we assume sub-solar metallicity Z = 0.01.
In practical terms, in our evolutionary simulations (see Sects. 2, 3, and 4) we assume that the entire considered mass (Mell,tot) forms stars at one specific time (delta function SFR) in the past. Subsequently, we test whether this amount of stars can form enough NS-NS mergers to account for detection of GW170817 with the current LIGO/Virgo sensitivity. The LIGO/Virgo estimated rate of NS-NS mergers based on this single detection is at the level of 1.5 yr−1 within 100 Mpc3 (with 90% credible range: 0.3–4.7 yr−1; Abbott et al. 2017).
2 Classical isolated binary evolution
2.1 Overall description
We use the population synthesis code StarTrack (Belczynski et al. 2002, 2008) to evolve stars in isolation (in galactic fields) without taking into account effects of rapid rotation to generate a population of NS-NS binaries. We start with Mell,tot = 1.1 × 10¹⁴ M⊙ stars with initial properties guided by recent observations (Sana et al. 2012) and assume 100% binary fraction. Some of the binary configurations leading to mass transfers and common envelope (CE) survive through supernovae that may or may not disrupt them to form close NS-NS binaries that merge We choose an evolutionary model in which we adopt our standard input physics (see Sect. 2.2) with the additional assumptions that each stable RLOF is fully conservative (i.e., no mass is lost from a binary) and that stars on Hertzsprung gap are allowed to initiate and survive CE. This tends to increase NS-NS merger rates in classical isolated binary evolution (Chruslinska et al. 2018). The typical formation of a NS-NS system involves a common sequence: RLOF (from primary), CE (from secondary), and RLOF (from secondary). However, with the above assumptions, progenitors evolve typically through a different sequence: RLOF (from primary), CE (from secondary), and CE (from secondary). Two CE events lead to formation of very close NS-NS systems which increases merger rates. During conservative RLOF (from the primary), the secondary star becomes more massive than in the non-conservative case. This makes the secondary envelope, when it expands after the main sequence, more massive and the ensuing CE leads to a more drastic orbital decay. After the first CE, the secondary exposed helium core expands and initiates a second CE (rather than RLOF as it is more massive than in the non-conservative case) right after the core-He burning phase (helium Hertzsprung gap). In general, keeping more mass (conservative RLOF) in binary systems allows NS-NS mergers to occur from lower-mass stars (increasing rates thanks to the IMF), and allowing for a more liberal application and survival of CE also increases rates (Dominik et al. 2012).
Our simulations show that it is possible to form NS-NS mergers in old elliptical galaxies. An example is shown in Fig. 1 (a detailed description of this evolutionary example is given in Sect. 2.3). However, the predicted current merger rate of NS-NS systems from all ellipticals within 100 Mpc3 is low: Rnsns = 0.01 yr−1 for tsf = 5 Gyr. For comparison, the LIGO/Virgo estimated rate of NS-NS mergers is 1.5 yr−1 within 100 Mpc3. Our predicted rates decrease for the older star formation (see Table 1). Rates can be as high as Rnsns ~ 0.05 yr−1 for tsf = 1 Gyr, but this is still well below the LIGO/Virgo low estimate. Additionally, it is very unlikely that the majority of elliptical galaxies have stellar populations as young as tsf ≲1 Gyr.
The decrease of the merger rate with time is due to typically short delay times from star formation to NS-NS merger. Initial orbital separations are observed to be steep power-laws for massive binaries (e.g., ∝ a−1 – a−2; Kobulnicky et al. 2014; Sana et al. 2012). Complex evolutionary processes (mass exchanges, supernovae natal kicks and mass loss, CE evolution) are likely to modify orbital separations before NS-NS formation. However, NSs form from stars in a relatively narrow mass range and NS-NS merger formation is typically dominated by one specific evolutionary sequence (Dominik et al. 2012). The net effect of the evolutionary processes is rather similar for most of the NS-NS progenitors, decreasing initial separations to smaller values (CE evolution) and (approximately) steepening the shape of the orbital separation distribution (see Fig. 2). For NS-NS orbital separations that are a steep power-law (∝ a−3), the convolution with the gravitational radiation emission orbital decay timescale (∝ a4; Peters (1964)) results in a power-law delay time distribution ∝ t−1.5. The delay time scales as  . For our particular model (Z = 0.01) the majority of NS-NS mergers occur within 1 Gyr of star formation: 97% (see Fig. 5). Although the delay time distributions differ for other evolutionary models and other metallicities, they are still steep power-laws (Dominik et al. 2012). This implies that NS-NS mergers are typically predicted in young stellar populations (e.g., in starbursts or spirals with the ongoing/recent star formation), although some fraction is still to be expected even in galaxies with no star formation (e.g., ellipticals).
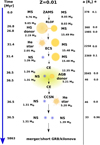 |
Fig. 1 Example of the formation of an NS-NS merger similar to GW170817 in the classical isolated binary evolution channel. |
Local NS-NS merger rates [yr−1] (within 100 Mpc3).
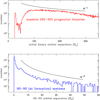 |
Fig. 2 Initial orbital separation of binaries that are progenitors of NS-NS mergers; we note that the distribution is close to a−1 (top). After binary evolution (mass transfers, supernovae, CE) close NS-NS systems form with much smaller orbital separations, and their orbital separation distribution may be approximated by a steep power-law: a−3 (bottom). |
2.2 Details of calculations
Our evolutionary modeling is performed with the StarTrack Monte Carlo population synthesis code (Belczynski et al. 2002). In particular, we incorporate a calibrated treatment of tidal interactions in close binaries (Belczynski et al. 2008), a physical measure of the common envelope (CE) binding energy (Dominik et al. 2012; Xu & Li 2010), and a rapid explosion supernova model that reproduces the observed mass gap between NSs and BHs (Belczynski et al. 2012). Our updated compact object mass spectrum covers a wide range of NS masses (MNS = 1.1–2.5 M⊙; Fryer et al. 2012). Neutron stars are formed from single stars with an initial mass range of Mzams = 7.4–7.9 M⊙ in electron capture supernovae and in the range Mzams = 7.9–21.0 M⊙ in core-collapse supernovae for the sub-solar metallicity considered in our study Z = 0.01. These ranges are subject to change due to effects of mass accretion and loss in binary evolution. In particular, even stars as massive as Mzams ~ 100 M⊙ may form NSs in binaries while losing most of their mass in “case A” RLOF (Belczynski & Taam 2008).
Based on our previous modeling (Chruslinska et al. 2018), we consider one specific variation of the binary evolution input physics that tends to increase NS-NS merger rates. We allow for Hertzsprung gap (HG) stars to initiate and survive CE evolution. This is an optimistic assumption, since these stars may not initiate the CE evolution, or may not survive as a binary if CE does happen (Belczynski et al. 2007; Pavlovskii & Ivanova 2015). We note that CE is a major evolutionary process needed for the formation ofdouble compact object mergers in our evolutionary framework (Belczynski et al. 2002). During CE we adopt a standard energy-based formalism to calculate the orbital decay (Webbink 1984) and we assume that 100% of orbital energy is used to eject the envelope; envelope binding energy is obtained from detailed calculation of stellar structure with partial inclusion of ionization energy (Dominik et al. 2012). During stable RLOF, we assume that mass transfer is fully conservative and no angular momentum is lost from the binary. This particular assumption allows for rather effective NS-NS binary formation. For NS formation in electron-capture supernova (ECS; Miyaji et al. 1980; Podsiadlowski et al. 2004) we assume that there is no associated natal kick. However, some small natal kick velocity (≲ 50 km s−1) may result from such explosions (Dessart et al. 2006; Jones et al. 2013; Schwab et al. 2015). We assume that NS forming in iron core-collapse SNe receive natal kicks with velocity components drawn from a one-dimensional (1D) Maxwellian distribution with rms σ0 = 265 km s−1 (Hobbs et al. 2005). The magnitude of the kick is further decreased by the amount of fallback estimated for each NS at its formation (important only for the heaviest NSs; Fryer et al. 2012). Natal kicks are assumed to have random direction. Lowering the iron core-collapse supernovae natal kicks leads to only moderate increase in the predicted NS-NS merger rates (e.g., using σ = σ0∕2 would increase the rates by a factor of ≲1.5; Chruslinska et al. 2017). For massive O/B stars that are NS progenitors, we apply mass and metallicity-dependent wind mass loss (Vink et al. 2001), while for naked helium stars we apply a combination of wind rate estimates that take into account Wolf-Rayet stellar wind clumping (Hamann & Koesterke 1998), and wind metallicity-dependence for Wolf-Rayet stars (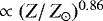 ; Vink & de Koter 2005).
Our model (for all NS progenitors) is computed with initial distributions of orbital periods ( ), eccentricities (∝ e−0.42), and mass ratios (∝ q0) appropriate for massive O/B stars (Sana et al. 2012). We adopt an initial mass function that is close to flat for low-mass stars (∝ M−1.3 for 0.08 ≤ M < 0.5 M⊙ and ∝ M−2.2 for 0.5 ≤ M < 1.0 M⊙) and top heavy for massive stars (∝ M−2.3 for 1.0 ≤ M ≤ 150 M⊙), as guided by recent observations (Bastian et al. 2010).
2.3 Example of calculations
An example of an NS-NS merger in an old host galaxy formed in our model of classical isolated binary evolution is shown in Fig. 1. The evolution begins with two relatively low-mass stars (Mzams,a = 9.76 M⊙ and Mzams,b = 8.05 M⊙) with moderately sub-solar (Z = 0.01) metallicity, placed on a wide (a = 378 R⊙) and almost circular orbit (e = 0.1).
Primary (initially more massive) star evolves off the main sequence (MS) and during the subsequent Hertzsprung gap evolution initiates a stable RLOF, transferring its entire H-rich envelope to the secondary star. In this process the primary turns into a low-mass naked helium star while the secondary becomes a massive (rejuvenated) MS star (Ma = 2.19 M⊙ and Mb= 15.49 M⊙; we note the mass ratio reversal). The orbit circularizes (e = 0) and expands in response to this fully conservative mass transfer (a = 1985 R⊙). During the late stages of its evolution, the primary expands to become a helium-rich giant (R ~ 100 R⊙) and loses part of its envelope in stellar winds, reducing its mass to Ma = 2.05 M⊙. This leads to a moderate orbital expansion (a = 2258 R⊙). Finally, the primary forms a low-mass oxygen–neon–magnesium core that collapses due to electron capture processes and leads to electron-capture supernova. We assume that a relatively lightweight (Ma = 1.26 M⊙) NS with no natal kick is formed in this process. However, a supernova mass ejection and neutrino emission (both assumed to be fully symmetric in ECS case) still affect the orbital parameters of the binary, increasing the orbital separation (a = 2369) and eccentricity (e = 0.1). The first NS forms t = 31.4 Myr after the beginning of its evolution on zero age main sequence (ZAMS).
As the massive secondary star evolves past MS, it expands and is subject to significant wind mass loss. During asymptotic giant branch (AGB) evolution its mass decreases (Mb = 12.35 M⊙), while its size increases enough (R ~ 800 R⊙) to start the second RLOF. Tidal forces (spinning up the expanding secondary) circularize the orbit (e = 0) and reduce the orbital separation (a = 2045). Due to high mass ratio (of AGB secondary to primary NS) at this time and response of convective envelope of the secondary to mass loss, this RLOF is dynamically unstable and leads to CE evolution. CE leads to severe reduction of the orbital size (a = 46 R⊙) of the system. The secondary is stripped of its entire H-rich envelope and becomes a massive helium star (Mb = 5.21 M⊙). We allow the primary NS to accrete during CE at 10% Bondi-Hoyle rate (MacLeod et al. 2017) and as a result the NS increases its mass (Ma = 1.31 M⊙). At time t = 36.5 Myr secondary star forms an iron core that collapses and the star explodes as Type Ib supernova. This supernova results in a significant mass of ejecta and we assume that 10% gravitational mass is lost in neutrino emission. We calculate the secondary NS mass (Ma = 1.39 M⊙). The explosion also leads to a moderately high natal kick (three-dimensional (3D) magnitude: 83 km s−1; either due to asymmetric mass ejection (Janka & Mueller 1994); asymmetric neutrino emission (Fryer & Kusenko 2006); or the combination of both) gained by the newly formed NS and the orbit becomes highly eccentric (a = 33 R⊙ and e = 0.96).
The orbital parameters of the resulting NS-NS binary lead to a long delay time of 5.8 Gyr (Peters 1964). Such a system might have formed long ago in NGC 4993 and would have merged close to the present time, allowing for the detection of gravitational waves similar to GW170817 and would be accompanied by short GRB and kilonova. However, we note that this is not a typical NS-NS binary found in our simulations. The majority of merging NS-NS systems form with short delay times (t ≲ 1 Gyr; ∝ t−1 or somewhat steeper) and follow other formation channels (Chruslinska et al. 2018).
3 Globular cluster dynamics
3.1 Overall description
We use the MOCCA code (Giersz et al. 2013) to compute a suite of globular cluster (GC) models with updated prescriptions for binary and stellar evolution. For all NS progenitors we have adopted a standard IMF (Kroupa 2001) and evolved stars with initial properties (orbital periods: 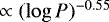 , eccentricities: ∝ e−0.42, and mass ratios: ∝ q0, as observed for massive O/B stars (Sana et al. 2012). The difference between this IMF and the one used for the field calculations in Sect. 2.2 is that stars between 0.5 and 1.0 M⊙ have a power-law index of − 2.3 instead of − 2.2 and a maximum initial ZAMS mass of 100 M⊙ instead of 150 M⊙. The evolution of 27 GC models was simulated to 15 Gyr and the models span a range of initial parameters including cluster mass, size, and binary fraction (see Sect. 3.2). All GC models were initially isotropic King (1966) models with a central concentration parameter (W0) value of 6. The current Milky Way mass fraction in GCs is ≲0.002, and GCs were initially approximately five times more massive (Webb & Leigh 2015). We assume that the same holds for elliptical galaxies and that the fraction of stellar mass of elliptical galaxies (Mell,tot) found in GCs is 0.01. This gives total initial mass Mgc,tot = 1.1 × 10¹² M⊙ in all GCs found in all ellipticals within 100 Mpc3. Based on observations of 48 000 globular clusters in seven supergiant cluster galaxies (Harris et al. 2014) we adopt a log-normal initial GC mass distribution with mean Mgc,ave = 1.8 × 10⁶ M⊙ and σ = 0.5 in the range of plausible initial GC masses: Mgc = 5 × 10³ − 5 × 10⁷ M⊙. This corresponds to Ngc = 6.4 × 10⁵ GCs in ellipticals within 100 Mpc3.
We find that our GC models can dynamically produce NS-NS binaries that will coalesce within a Hubble time (e.g., Fig. 3). The number of coalescing NS-NS binaries in a GC cluster model heavily depends on the initial parameters and in particular on the initial cluster mass:  . This relation shows that a GC with an initial mass of 7 × 10⁵ M⊙ can at best produce two NS-NS mergers. The predicted GC NS-NS merger rate from all ellipticals within 100 Mpc3 for tsf = 5 Gyr is Rnsns = 5 × 10⁻⁵ yr−1. Our estimated rate increases with decreasing age of the GC. In particular, Rnsns = 2 × 10⁻⁵ yr−1 for tsf = 10 Gyr, and Rnsns = 5 × 10⁻⁴ yr−1 for tsf = 1 Gyr.
Although there are differences in the initial setup and a few prescriptions for physical processes involved in isolated binary evolution are different, the most optimistic GC merger rates of NS-NS binaries are approximately two orders of magnitude lower than the rates from classical isolated binary evolution (see Table 1). The main reason for this is the fact that the stellar mass in GCs is much lower (0.01 Mell,tot) than in the field (Mell,tot). Although a GC model can dynamically form many BH-BH binaries during its dynamical evolution, the number of dynamically formed NS-NS binaries is much lower. Initially dense GC models with large escape velocities that would retain a high fraction of NSs (≳ 0.5) are also more likely to retain a high fraction of BHs. These retained BHs can segregate to the center of the GC, forming a subsystem comprised of single and binary BHs that will provide energy to the surrounding stars and support the evolution of the GC (Breen & Heggie 2013a,b). Many recent GC simulations (Morscher et al. 2013, 2015; Sippel & Hurley 2013; Heggie & Giersz 2014; Wang et al. 2016; Peuten et al. 2016; Rodriguez et al. 2016c; Arca-Sedda et al. 2018b; Askar et al. 2018) have shown that depending on the initial GC model, such a subsystem of BHs can survive up to a Hubble time and dominate the central dynamics of the GC. The presence of a sizeable BH subsystem prevents segregation of NSs to the GC center which inhibits the formation of NS-NS binaries through strong dynamical interactions. For a moderately dense GC model (with initial half mass radius of rh = 1.2 pc and galactic tidal radius of rt = 60 pc), we note a peak of NS-NS mergers originating from primordial binaries within the first gigayear of GC evolution. Subsequently, there is a long period (1–10 Gyr) of low NS-NS merger rate (primordial NS-NS mergers dying off, while dynamical NS-NS mergers are just beginning to appear), and finally dynamical mergers are beginning to peak at late times (> 10 Gyr after the star formation). This late time corresponds to the depletion of the BH subsystem and the subsequent core collapse of the GC. NS-NS mergers are found to take place either within GCs (~ 35%) or after ejection from their host GCs (~65%).
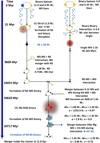 |
Fig. 3 Example of the formation of an NS-NS merger similar to GW170817 in the globular cluster dynamical channel. |
3.2 Details of calculations
Results are obtained using the MOCCA (MOnte Carlo Cluster simulAtor) code for star cluster simulations (see Giersz et al. 2013; Hypki & Giersz 2013, and reference therein). The code treats dynamical relaxation of stars and binary systems in spherically symmetric star clusters using the Monte Carlo method for stellar dynamics developed by Hénon (1971) which was further improved by Stodolkiewicz (1986) and Giersz (1998). For strong dynamical interactions between binary systems and binaries and single stars, MOCCA uses the FEWBODY (Fregeau et al. 2004) for simulating small-N gravitational dynamics. For basic stellar and binary evolution routines, the MOCCA code uses prescriptions from the SSE/BSE code (Hurley et al. 2000, 2002) with updates which include formation and proper treatment of NSs via ECS and accretion induced collapse (AIC). Other changes were also made to SSE/BSE prescriptions (Belloni et al. 2018) based on recent updates to stellar/binary evolution routines in the latest versions of NBODY61 and StarTrack.
The evolution of 27 GC models was simulated up to 15 Gyr and these models spanned a range of initial parameters which include cluster mass (from 6.25 × 10⁴ M⊙ up to 1.3 × 10⁶ M⊙, size (half-mass radii of 1.2 and 2.4 pc), Galactocentric radius (2.5 kpc to 10.8 kpc), binary fraction (10% and 95%) and metallicity (Z = 0.01 and Z = 0.002). All models were initially non-segregated isotropic King (1966) models with a central concentration parameter (W0) value of six, and each model also has a two-component IMF given by Kroupa (2001) with stellar masses in the range 0.08 to 100.0 M⊙. For models with 95% initial binaries, the semi-major axis, eccentricity and mass ratio distributions are given by Belloni et al. (2017a); Kroupa (1995), and in particular for binaries with O/B stars Sana et al. (2012) distributions are used. For models with 10% binaries, we used a uniform mass ratio distribution, a uniform distribution in the logarithm of the semi-major axis and a thermal eccentricity distribution. BH natal kicks were computed using the mass fallback prescription of Belczynski et al. (2002). The prescription for BH natal kicks is different from the one used for the field calculations. We do not expect that a different fallback prescription for BHs will drastically change the results for NS-NS binaries that originate from GCs. Having high natal kicks for BHs could be helpful in preventing the formation of a BH subsystem which may lead to more centrally segregated NSs, some of which may dynamically form NS-NS binaries. However, giving large natal kicks to BHs would undermine results estimating BH-BH binaries pro- duced in GCs (Rodriguez et al. 2015, 2016a,b,d; Askar et al. 2017; Park et al. 2017). NSs formed in iron core-collapse were given natal kicks with a Maxwellian distribution with σ = 100 km s−1 or zero natal kicks to have a higher NS retention fraction and for checking the maximum contribution that GC NS-NS binaries could give to merger rates. These values are significantly lower than NS natal kick values that are typically used in GC simulations. Based on proper motion estimates of pulsars in our Galaxy (Hobbs et al. 2005), NS natal kicks are usually given by a Maxwellian distribution with σ = 265 km s−1. In all models, NSs forming via ECS or AIC were given zero natal kicks at birth.
For a small sub-sample of models, additional runs were also simulated in which common envelope evolution parameters were changed in order check the influence of CE on NS-NS formation. We either calculated the binding energy parameter λ for the giant in CE (by setting λ to 0.0 in BSE) or fixed the value to be λ = 0.05. For all runs, the α parameter, which is the fraction of orbital energy used to unbind the envelope was set to 1 (see Sect. 3.2 in Belloni et al. 2017b, for details about CE in BSE). It is important to stress that the purpose of this study was to obtain an order of magnitude estimate for the rate, and for this reason, a limited number of GC models with assumptions conducive to formation of NS-NS binaries (low and zero natal kicks) were simulated. Future works will cover a more detailed parameter space in combination with better constraints for the galactic environment.
Each model was checked for the number of NS-NS mergers that occur inside the cluster and the number of escaping NS-NS binaries that would merge within a Hubble time. Table 2 provides a summary of the initial models that contributed to forming coalescing NS-NS binaries along with the range of their final masses and number of NS-NS binaries they produced. From the limited number of simulations, we found 34 coalescing NS-NS binaries. Twenty-one of these are escaping NS-NS binaries that merge within a Hubble time and 13merge inside the cluster. Although there are not many merging NS-NS binaries from the simulated cluster models, we find that more massive clusters produce greater numbers of such binaries (see Fig. 4). While there is a large number of single NSs in high-binary-fraction models with λ = 0.05 for CE compared to models with λ = 0.0, there is no significant dependence of the number of merging NS-NS systems on CE parameters or metallicity. Our most massive models, with zero NS natal kicks can produce four coalescing NS-NS binaries. The number of NS-NS binaries is correlated with the initial mass of the GC:
 (1)
(1)
The coalescence time distribution for these merging NS-NS binaries shows a peak within 1 Gyr of cluster evolution. These are mostly NS-NS binaries that formed from the binary evolution of primordial binaries. Figure 5 shows the cumulative distribution of merger times for NS-NS binaries originating in GCs. The first gigayear of GC evolution produces 70% of all our NS-NS mergers. Between 1 and 11 Gyr, we note a production of 20% of coalescing NS-NS binaries (nearly a uniform distribution in time). Between 11 and 14 Gyr, a small peak is noted that contains 10% of GC NS-NS mergers. These late-merging NS-NS binaries mostly form because of dynamical interactions of NSs and other binary systems that begin to segregate and form binaries in response to the core collapse of the GC as its BH population starts to deplete. In many cases (40%), the NSs in these coalescing binary systems form from AIC of an oxygen–neon–magnesium WD or through mergers of WDs. Formation of such an NS is illustrated in Fig. 3. The small peak in merger rate between 11 and 13 Gyr is particularly interesting as Blanchard et al. (2017) estimated using observations and stellar spectral population synthesis models that the star formation in NGC 4993 peaked 10 Gyr ago and that the median merger time for GW170817 may be as high as 11.2 Gyr.
For the rate calculation presented in Sect. 3 we made many approximations to get a first-order estimate of the merger rate. It is assumed that GCs contain 0.02% of the current stellar mass in all elliptical galaxies within 100 Mpc. This assumption is based on the observed relations between the total stellar mass of an elliptical galaxy and the amount of mass in GCs (see Fig. 8 in Harris et al. 2015). We know from Milky Way GCs that their initial mass had to be larger to account for their current masses. Assuming that, on average, GCs were up to five times more massive than their current mass Webb & Leigh (2015), we adopt that 1% of all initial stellar mass in ellipticals is in GCs. We further assume that the initial GC mass distribution follows the observed log-normal luminosity distribution of GCs that was observed by Harris et al. (2014). This log-normal luminosity distribution was used by Rodriguez et al. (2015, 2016a) to obtain a current log-normal mass function for GCs assuming a mass-to-luminosity (M/L) ratio of two. Taking a log-normal distribution with mean mass value of log10(M) = 5.54 and σM = 0.52 (Rodriguez et al. 2016a), we sample GC masses and multiply each of them by a factor of five to obtain a cumulative initial mass of 4.5 × 10¹²M⊙. Initial masses for GCs are then used to estimate the number of coalescing NS-NS binaries that could potentially originate from those systems using the power-law relation shown in Eq. (1). We assume that all GCs with initial masses lower than 3 × 10⁵M⊙ will produce at least one coalescing NS-NS binary. Using the total number of coalescing NS-NS binaries produced by all GCs in conjunction with the merger time distribution inferred from the few coalescing NS-NS binaries that emerged from the GC models, we can estimate the expected number of mergers in different time intervals.
Taking that ~70% of the mergers occur within the first gigayear, we estimate merger rates for NS-NS binaries originating from GCs in elliptical galaxies in 100 Mpc to be ~ 2 × 10⁻³ yr−1. For the 5-Gyr rate calculation, we take that 6% of the total NS-NS mergers occur around this time (4–7 Gyr) and find that this corresponds to a merger rate of ~2 × 10⁻⁴ yr−1. For 9 to 11 Gyr, we take that 5% of the mergers occur within this interval, andcompute the rate to be ~1 × 10⁻⁴ yr−1. As in field calculations, the rates decrease with aging population. However, for GCs between 11 and 13 Gyr, there is an increase in the number of merging NS-NS binaries. If we assume that 10% of the coalescing binaries will merge between 11 and 13 Gyr, then the rate at this interval is ~ 3 × 10⁻⁴ yr−1.
The rates presented here are based on many favorable assumptions and are optimistic. While, it could be possible that the contribution from GCs could be an order of magnitude higher if they made up for a higher fraction of the total stellar mass in elliptical galaxies, the natal kicks used in our model are much lower than the typical kicks derived from observations of proper motions of pulsars (Hobbs et al. 2005). High natal kicks for NSs would make it more difficult to retain them in GCs and this would significantly reduce the expected rate. It is possible to form NSs via other channels in dense environments through dynamical interactions; however, in order to do this, GCs must undergo core collapse. In models that retain a high number of BHs and NSs, a BH subsystem can provide energy to the system preventing core collapse. Only during the later evolution of such clusters, when BHs have depleted, do NSs start to segregate. BHs can quickly deplete in dense models with short half-mass relaxation time. However, initially dense GCs can form an intermediate-mass BH (Giersz et al. 2015) which can then deplete the population of compact objects in the cluster. In order to properly and thoroughly investigate the production of NS-NS binaries in GCs, a larger set of simulations covering a larger initial parameter space is necessary.
Initial parameters for globular cluster models.
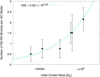 |
Fig. 4 Correlation between initial mass of GCs and the estimated number of NS-NS binaries such a cluster could produce. The error bars represent the Poisson error in the number of NS-NS mergers that form in GCs with a given initial mass. |
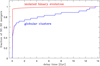 |
Fig. 5 The normalized cumulative distribution of NS-NS merger delay time (from star formation to the merger) for classical isolated binary evolution and globular cluster formation channels. The isolated binary calculations formed 52 182 NS-NS mergers and there were 34 NS-NS mergers in GC simulations. |
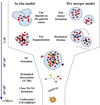 |
Fig. 6 Example of the formation of an NS-NS merger similar to GW170817 in a nuclear cluster. |
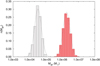 |
Fig. 7 GC mass distribution in one of the smallest (Mg ~ 3.2 × 10⁸ M⊙, gray boxes) and largest (Mg = 5 × 10¹¹ M⊙, red boxes) galaxy models. |
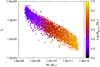 |
Fig. 8 NC mass normalized to the total GCs mass, as a function of the stellar galaxy mass. The color-coded map shows the mean mass of GCs that contributed to the NC assembly. |
3.3 Example of calculations
An example of an NS-NS binary that forms and merges inside a GC at 11 Gyr is shown in Fig. 3. The GC model in which this merging NS-NS formed had initially 1 × 10⁶ objects with a binary fraction of 95%, metallicity Z = 0.01, and initial half-mass and tidal radii of 1.2 pc and 60 pc, respectively. NS natal kicks were given by a Maxwellian distribution with σ =100 km s−1, and CE parameters were α = 1 and λ = 0.05. The merging NSs originated from two separate initial binaries in this GC model.
The first NS formed as an end product of the evolution of an 11 M⊙ star (primary) that was in a wide binary system with a 4.95 M⊙ companion. This binary had an initial semi-major axis of 4937 R⊙ and an eccentricity of 0.17. After 31 Myr of evolution, the primary star became an NS in a core-collapse SN (see left side of Fig. 3). This ~ 1.3 M⊙ NS received a natal kick and became a single star, but was still retained in the GC. For the next ~ 9.5 Gyr, this NS remained in the GC and did not undergo any strong dynamical interactions. At ~ 9.6 Gyr, the NS approached the GC center as the GC evolved towards core collapse. At this time the NS undergoes astrong interaction with a binary system comprising two main sequence stars with masses of 0.4 M⊙ and 0.7 M⊙. During this binary-single interaction, the 0.4 M⊙ MS star merged with the NS resulting in the formation of a 1.7 M⊙ NS. The 0.7 M⊙ MS star then became the binary companion of this heavy NS.
At 10.45 Gyr, this NS-MS binary interacted with an Oxygen–Neon–Magnesium (ONeMg) WD of mass 1.3 M⊙. This heavy WD had formed from the evolution of a 6.9 M⊙ star (see right side of Fig. 3). During the binary-single interaction between the NS-MS binary and the WD, the 0.7 M⊙ MS star was exchanged from the binary and the WD took its place resulting in the formation of an NS-WD binary. At 10.60 Gyr, the NS-WD binary interacted with a low-mass MS star of 0.12 M⊙. During this interaction, the 0.12 M⊙ MS star merged with the WD forming an AGB star. Now the NS is in a CE binary with an AGB star. This CE binary had an orbital separation of 1252 R⊙ and eccentricity e = 0.97. During the CE, mass was transferred from the AGB onto the NS increasing the mass of the NS from 1.7 M⊙ to 1.9 M⊙. The CE phase exposed again the 1.3 M⊙ ONeMg WD (the AGB star envelope successfully ejected). The post-CE NS-WD binary circularized (e = 0) during the CE phase and had an orbital separation of 3 R⊙. At 10.7 Gyr, this NS-WD binary interacts with a Carbon–Oxygen (CO) WD with mass 0.68 M⊙. During this interaction, the ONeMg WD merges with the CO WD resulting in the formation of a NS of 1.26 M⊙ due to AIC. We assume no natal kick in the AIC NS formation process. Following this interaction, we get a NS-NS binary comprising NSs of 1.9 M⊙ and 1.26 M⊙ with an orbital separation of 3.5 R⊙ and (dynamical interaction induced) eccentricity of e = 0.75. This NS-NS binary merges inside the GC at ~11 Gyr due to gravitational wave emission.
Most of the GC NS-NS mergers have short delay times: 70% of the mergers have delay times ≲ 1 Gyr (see Fig. 5). These mergers host NSs from the evolution of massive stars that have formed via regular (iron) core-collapse SNe. NS-NS binaries that merge at later times (10–14 Gyr) form typically in the way shown by the example discussed in this section. In some cases, both the NSs in the binary form via AIC of WDs or through ECS. As in our example, in certain cases the mass of one of the NSs is increased due to a prior merger with another star. The formation of an NS from the merger of an ONeMg WD with a CO WD could possibly produce a radio transient (Moriya 2016) or a short gamma-ray burst (Lyutikov & Toonen 2017). The number of such binaries is too low in our simulated models to make reliable comparisons of physical properties of GC NS-NS mergers with NS-NS mergers formed in isolated binary evolution. In future studies, we plan on increasing statistics of our GC models to deliver thorough comparison of GC and isolated binary evolution NS-NS mergers.
4 Nuclear cluster dynamics
4.1 Overall description
We use a semi-analytic approach for modeling nuclear cluster (NC) formation in galactic nuclei (Arca-Sedda & Capuzzo-Dolcetta 2014b), coupled with results on NS-NS mergers in GCs achieved through a series of MOCCA models. We consider two basic scenarios of NC formation: a dry-merger model via GCs segregation and mergers into galacticcenters (Tremaine et al. 1975; Capuzzo-Dolcetta 1993; Antonini 2013) and an in-situ model from gas depositsin galactic centers (King 2003; Bekki 2007; Nayakshin et al. 2009). A way to disentangle the two processes is to examine observational NC-host galaxy connections (Côté et al. 2006; Graham 2012; Turner et al. 2012).
Taking advantage of semi-analytic techniques, several authors have shown that the dry-merger scenario provides theoretical correlation laws in good agreement with observations (Antonini 2013; Arca-Sedda & Capuzzo-Dolcetta 2014a; Gnedin et al. 2014). Moreover, a number of studies provide detailed numerical modeling of NC formation through dry-merger mechanisms in galaxies mass range typical of dwarf galaxies (Arca-Sedda & Capuzzo-Dolcetta 2016, 2017c), Milky Way-like galaxies (Antonini & Perets 2012; Arca-Sedda et al. 2015, 2018a; Tsatsi et al. 2017), and massive ellipticals (Arca-Sedda & Capuzzo-Dolcetta 2017b). In particular, the dry-merger scenario provides an excellent explanation for the observational dearth of NCs in the galaxy mass range Mg > 1011 M⊙, which is observed when the expected supermassive BH mass overtakes the NC mass (Neumayer & Walcher 2012; Arca-Sedda & Capuzzo-Dolcetta 2014a). Indeed, it has been shown that above this galaxy mass threshold the supermassive BH tidal force is sufficient to disrupt the infalling clusters and prevent the NC formation (Antonini 2013; Antonini et al. 2015; Arca-Sedda & Capuzzo-Dolcetta 2014a, 2017b; Arca-Sedda et al. 2016).
It has been shown that the relation connecting the NC mass, MNC, and the host galaxy velocity, σg, was similar to the MNC − σg relation well known for supermassive BHs (Ferrarese et al. 2006). However, later studies revealed that the NC MNC − σg relation is much shallower (Leigh et al. 2012; Scott & Graham 2013; Georgiev et al. 2016), thus suggesting that the processes at play for NC and supermassive BH formation are likely unrelated, at least in part. The observed MNC − σg relation represents a unique tool to disentangle the possible NC formation scenarios. Moreover, as pointed out by Rossa et al. (2006), NCs are characterized by a complex star formation history, being characterized by an old stellar population with ages of ~ 10 Gyr and a younger population, with estimated ages below 100 Myr. This feature is also observed in the Milky Way NC, possibly suggesting that several bursts of in-situ star formation occurred over its entire lifetime (Baumgardt et al. 2018).
Although the dry-merger scenario has proven adept at explaining the observed NC scaling relations, it is quite difficult to explain NC complex star formation history, which is instead well represented in the in-situ scenario. In fact, it is generally believed that both processes are at play during NC formation, although it is rather difficult to determine which one dominates.
In the dry merger model, we assume that fa = 0.7 of elliptical galaxies have NCs, that fb = 0.01 of the total galaxy mass is found in GCs, and that only some fraction (fc) of GCs contribute to the formation of NCs. This gives the total stellar mass in NCs found in all elliptical galaxies within 100 Mpc: Mnc,tot = fafbfc Mell,tot. Each elliptical galaxy is populated with GCs with masses as given in Sect. 3 and the number of GCs per host galaxy is proportional to host mass. We examine which GCs have a dynamical friction timescale shorter than the tidal disruption timescale in a given host galaxy, which is the typical time over which galactic tidal forces drive the GC dissolution. Each such GC is assumed to contribute its mass (and NS-NS mergers given by MOCCA simulations) to the host galaxy NC. We find a wide range of NC masses: Mnc = 104–108 M⊙ with a typical mass of Mnc,ave = 107 M⊙.
We assume that elliptical galaxy masses are distributed in the range Mell = 108–1012 M⊙ according to a Schechter function with typical parameters drawn according to observations of the local Universe (Conselice et al. 2016). Varying the slope of the mass density profile and effective galaxy radius and averaging over the galaxy mass range, characterized by a mean mass of elliptical galaxy (Mell,ave = 1.6 × 10⁹ M⊙), we get fc = 0.17 (see Sect. 4.2).
NC formation occurs on a typically longer timescale (~ 20–200 Myr: Arca-Sedda et al. 2015) than formation of a NS in core collapse (~ 10–50 Myr), but on a shorter timescale than NS-NS merger dynamical formation (> 1 Gyr). Therefore, if an NS is subject to a strong natal kick, and if it was removed from a GC, it does not contribute to the calculations of NC NS-NS merger rates. However, dynamical formation of NS-NS mergers is enhanced by high NC mass:  , where we have used average GC and NC mass in our simulations. The NC NS-NS merger rate is then:
 (2)
(2)
NC NS-NS merger rate is very small: 6 × 10⁻⁵ yr−1 for tsf = 5 Gyr and this is due to the fact that only a small fraction (fc = 0.17) of GCs contribute to the formation of a typical NC.
In the in-situ model, we assume that NC masses are the same as in the dry-merger model. The only boost to NS-NS merger rate in the in-situ model comes then from the higher retention fraction of NSs. The typical retention fraction of NSs formed in supernovae (subject to a potential natal kick) is fns ~ 0.3 for our GC assumptions (natal kicks with σ = 100 km s−1 for core-collapse supernovae and 0 km s−1 for electron capture supernovae). We note that a fraction: faic ~ 0.5 of NSs form from white dwarfs in GCs without a natal kick (either in white dwarf mergers or during accretion-induced collapse during mass transfer in close binary). Therefore, if we allow all NSs to remain in NC, the rate increase may be estimated as (1 − fns)(1 − faic) = 0.35. It is expected that some NCs form via dry mergers and some in-situ. Even if the majority of mergers form in-situ, the rate increase to the rate estimate given by Eq. (2) is negligible in the context of our study (≲ 35%) and we neglect it in the values reported in Table 1.
4.2 Details of calculations
We made use of the semi-analytic approach described by Arca-Sedda & Capuzzo-Dolcetta (2014b) to calculate the NC masses as a function of their host galaxy mass. To do this, we created 2750 galaxy models at varying galaxy total mass, inner slope of the density profile, and galaxy effective radius.
In order to model the galaxy we used the Dehnen (1993) family of potential-density pairs, whose density profile is given by:
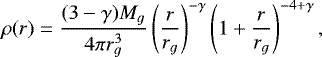 (3)
(3)
where γ is the inner slope of the galaxy density profile, Mg is the galaxy total mass and rg its length scale which is connected to the galaxy effective radius through the relation
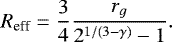 (4)
(4)
For eachgalaxy model we selected γ randomly between 0 and 1, in order to consider both cored and cuspy systems. The effective radius is varied according to the following relation
 (5)
(5)
with Ag = 0.706 ± 0.005 kpc and Bg = 0.165 ± 0.001. This produces effective radii in quite good agreement with observed galaxies in terms of effective radii and velocity dispersions, as shown in Arca-Sedda & Capuzzo-Dolcetta (2014b).
Once the galaxy model has been set, we populate it with GCs, provided that the GC system total mass is
 (6)
(6)
Our assumption relies upon the recent discussion by Webb & Leigh (2015), which suggests that Galactic GCs are characterized at their birth by an initial mass at most ~ 4.5 times their current values, provided that their current Mgc,tot is ≲ 0.002 Mg.
The GCmasses are kept according to a log-normal distribution with a mean value that depends on the galaxy mass through the relation
![Mathematical equation: \begin{eqnarray*}M_{\textrm{gc,ave}} &=& 2.5\times 10^3 \,{M}_{\odot} \left(5-\log\frac{M_g} {10^8\,{M}_{\odot}}\right) \\ & & \times \left[ 1 + 0.08 \left(\frac{M_g}{10^8\,{M}_{\odot}}\right)^{0.75} \left(8+\log\frac{M_g}{10^8\,{M}_{\odot}}\right) \right].\nonumber \end{eqnarray*}](/articles/aa/full_html/2018/07/aa32428-17/aa32428-17-eq14.png) (7)
(7)
This equation allows us to model the GC mass distribution while taking into account the fact that smaller galaxies host, on average, smaller GCs. This choice leads to Mgc,ave ~ 2.3 × 10⁴ M⊙ for galaxies with Mg = 108 M⊙, and Mgc,ave ≃ 1.6−1.8 × 10⁶ M⊙ for galaxies in the mass range 1011−1012 M⊙.
A further constraint that we required in the GC sampling process is that their mass density distribution follows the same mass density profile as that of the host galaxy. In principle, there is no reason for assuming that the GC population formed with a different distribution compared to galactic stars. We note that our choice of GC system density profile leads to very good agreement with observed NCs (Arca-Sedda & Capuzzo-Dolcetta 2014b).
For each GC in our galaxy model, we calculated two typical time-scales: the dynamical friction time-scale tdf, which represent the time over which the GCs orbitally segregate to the galactic center, and the tidal disruption time ttd, the time over which the galactic field drives the GC dissolution. The tdf has been calculated according to the approach described in Arca-Sedda & Capuzzo-Dolcetta (2014a), which shows, through theoretical arguments and numerical simulations, how tdf is connectedto the galactic properties and the GC orbit:
 (8)
(8)
where t0 is a normalization factor, g(egc, γ) is a function connecting the eccentricity of the GC orbit in the galaxy and the galaxy density slope, and rgc is the GC orbital radius. This formula shows a remarkably good agreement with N-body simulations tailored to dwarf galaxies (Arca-Sedda et al. 2016; Arca-Sedda & Capuzzo-Dolcetta 2017a), normal galaxies (Arca-Sedda et al. 2015, 2018a; Petts et al. 2015, 2016) and massive ellipticals (Arca-Sedda & Capuzzo-Dolcetta 2017b, 2016). The tidal disruption time is calculated as the minimum between the two-body relaxation dissolution time (Lamers et al. 2010) and the time over which the GC dissolves due to repeated passage at pericenter within the host galaxy (Arca-Sedda & Capuzzo-Dolcetta 2014b).
Our approach leads to a clear correlation connecting the NC and the galaxy stellar masses, which is given by
 (9)
(9)
with Anc = 1.000 ± 0.005 and Bnc = −3.17 ± 0.05, very similar to the most recent observational correlations (Scott & Graham 2013; Georgiev et al. 2016; Capuzzo-Dolcetta & Tosta e Melo 2017) and to earlier theoretical estimates (Arca-Sedda & Capuzzo-Dolcetta 2014b; Gnedin et al. 2014).
A crucial quantity needed to calculate the NS-NS merger rate for NCs is the fraction of the total GC population mass that ends up in the NC, fc(Mg) = Mnc∕Mgc,tot. Figure 8 shows how this quantity varies at varying galaxy stellar mass. To convert our total galaxy masses into galaxy stellar masses we used the relation (Gallazzi et al. 2006)
 (10)
(10)
As discussed above, our approach relies upon several specific assumptions that may affect the calculation of fc. In order to partly alleviate this issue, we assume a 30% error in calculating fc(M*), and note that its relation is enclosed within two power laws
 (11)
(11)
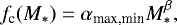
with β = −0.5, αmax = 1.7 × 10⁻² and αmin = 0.55 × 10⁻². In the following, we make use of these two limiting quantities to calculate the average fc (M*) value in the local Universe.
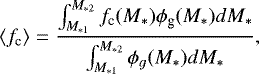
Assuming that galaxies in the local Universe are distributed according to some mass function ϕg (M*), we can average fc(M*) over the galaxy population:
 (12)
(12)
with M*1 = 108 M⊙ and M*2 = 1012 M⊙ being the minimum and maximum considered galaxy masses. A typical galaxy mass distribution is the Schechter (1976) mass function, according to which  . We used the parameters provided by (Conselice et al. 2016) for galaxies at redshift z < 0.2: A =−1.19 and the mass scale logMs = 11.20. The solution of the equation above is given by
 (13)
(13)
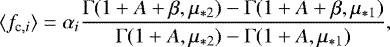
where the subscript i refers either to the maximum or minimum value of α, Γ (a, b) is the incomplete gamma function, and μ*i = M*i∕Ms. Averaging over the maximum and minimum values for α we get
 (14)
(14)
This implies that only ~17% of the whole GCs initial population contribute to the NC formation in the dry-merger model, making such a channel for NS-NS merger the least effective among those proposed here. We note that our results depend on the choice of the initial GC mass function, which relies upon the presently observed GC distribution, inside and outside the Galaxy. A wider mass function may possibly increase the number of GCs falling into the growing NC, leading fc to increase. Onthe other hand, NCs are the densest stellar systems observed in the Universe, and this may prevent NS-NS formation via dynamical interactions, or at least cause delay, by the presence of a central dense BH subsystem or supermassive BH seed.
4.3 Example of calculation
The NGC 4993 galaxy has a stellar mass M* = 4.4 × 10¹⁰ M⊙ (Blanchard et al. 2017); the corresponding dynamical mass can be calculated using Eq. (10). Hence, according to Eq. (6) the initial mass in GC will be
 (15)
(15)
while the GC initial average mass is given by Eq. (7)
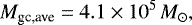 (16)
(16)
thus implying a number of GCs ending up in the galaxy nuclear star cluster
 (17)
(17)
Using Eq. (1) we can calculate the total number of potential NS-NS mergers in this galaxy as
 (18)
(18)
As discussed in Sect. 4.2, ~70% of these 108NS-NS binaries will merge in the first gigayear of the nuclear star cluster lifetime, ~ 20% in the time interval 1–11 Gyr and ~10% in the time range 11–14 Gyr.
5 Discussion and Conclusion
Theoretically obtained NS-NS merger rates may be compared with several empirically based estimates. For example, our earlier analysis of the isolated binary evolution channel shows perfect agreement with the observed Milky Way population of NS-NS systems, and acceptable agreement with short Gamma-ray burst rate estimates (Chruslinska et al. 2018)2. Inferences on the NS-NS merger rate can be also made from measurements of metal enrichment in the local Universe (Côté et al. 2018). All these empirically based estimates are subject to large uncertainties. Pulsar beaming and luminosity function limit estimates of Galactic NS-NS merger rates, beaming and luminosity function and an unknown contribution of BH-NS mergers limit short Gamma-ray burst NS-NS merger rates. Furthermore, merger ejection mass along with an unknown contribution of supernovae limit the inferences from r-process element observations. In this study we limit our discussion to comparison of theoretically estimated NS-NS merger rates with gravitational wave data only. This datum (the LIGO/Virgo single detection) is currently the only direct measure of NS-NS merger rate.
Our numerical simulations indicate that the formation of NS-NS mergers in old stellar populations, although possible, is unlikely to recover the merger rate inferred from the detection of GW170817. This is surprising as the three tested NS-NS formation mechanisms, classical isolated binary evolution, dynamical evolution in globular clusters, and nuclear cluster formation scenarios, can reproduce the gravitational wave estimate of BH-BH merger rate.
It is noted that NGC 4993 shows some shell structures and dust lanes that may be possibly indicative of a recent merger (200–400 Myr ago) with another smaller galaxy (Palmese et al. 2017; Ebrová & Bílek 2018). If there was a recent burst of massive star formation in NGC 4993 induced by a galaxy merger, it is possible that GW170817 was formed in such an event and our analysis and conclusions do not hold. Our results and the rest of our discussion are based on the assumption that late-type galaxies do not experience recent vigorous (≲ 1 Gyr) star formation.
It cannot be excluded that GW170817 is a BH-NS merger as the primary compact object (1.36–2.26 M⊙: LIGO/Virgo 90% credible limit; Abbott et al. 2017) may be a BH. Detailed examination of BH-NS formation models is desired for all three mechanisms. However, the existing models do not indicate that changing the identity of GW170817 could solve the tension. For example, in the classical binary evolution, the local (z ≈ 0) BH-NS merger rate density is smaller (or at best comparable) to the NS-NS rates (Belczynski et al. 2017). The rest of the discussion isbased on the assumption that GW170817 is a NS-NS merger.
It is possible that the LIGO/Virgo detection of GW170817 is not a statistical coincidence, but that finding the first NS-NS merger in an old host galaxy is. In such a case, isolated classical binary evolution can marginally explain the LIGO/Virgo observation. Population synthesis results show that if the entire star formation (in old and young galaxies combined) is considered, then theoretical rates may reach as high as 600 Gpc−3 yr−1 (Chruslinska et al. 2018) or 400 Gpc−3 yr−1 (Kruckow et al. 2018) and thus are consistent with LIGO/Virgo lower 90% credible limit of 320 Gpc−3 yr−1. If this is thecase, then future LIGO/Virgo detections will show prevalence of NS-NS merger detections associated with host galaxies with ongoing (or recent) star formation. The rest of the discussion is based on the assumption that association of GW170817 with old host galaxy is not a statistical coincidence.
It cannot be excluded that the actual NS-NS merger rate is outside of the LIGO/Virgo 90% credible limit ( ), but the detection was made nevertheless (i.e., detection itself is a statistical coincidence). In this case, our models indicate that GW170817 was most likely formed in an old host galaxy through classical isolated binary evolution, which offers a (≳ 100 times) higher NS-NS merger rate than the dynamical formation scenarios in globular and nuclear clusters. The observational run O3 (2018/19) should clarify this open issue as the increased LIGO/Virgo sensitivity and new NS-NS merger detections (or lack thereof) will place a better constraint on the NS-NS merger rate.
However, if the NS-NS merger rate turns out to be as high as the most likely value of the LIGO/Virgo estimate (1540 Gpc−3 yr−1), this will indicate that our current understanding of formation process of NS-NS mergers in the three considered scenarios is incomplete. Either the initial properties of binaries were different in the past when stars were forming in NGC 4993, or the evolutionary processes that lead to the NS-NS merger formation are not yet understood. It is also possible that a solution exists within current input physics and associated uncertainties, but has not yet been found within the multi-dimensional parameter space. All these possibilities will need to be assessed and tested to inform our concepts of physics as derived from gravitational wave observations.
If all the above fails, other non-standard NS-NS merger formation scenarios must be considered and developed.
Acknowledgements
We thank the anonymous referee for detailed and constructive comments. We would like to thank thousands of Universe@home users that have provided their personal computers and phones for our simulations, and in particular to K. Piszczek (program IT manager). Authors acknowledge support from the Polish National Science Center (NCN) grants: Sonata Bis 2 DEC-2012/07/E/ST9/01360 (KB, MC, GW), Harmonia 6 UMO-2014/14/M/ST9/00707 (KB), Opus UMO-2016/23/B/ST9/02732 (AA, MG), UMO-2015/17/N/ST9/02573 (AA), and German Research Foundation (DFG) through the Sonderforschungsbereich SFB 881 grant (MAS). GW is partly supported by the President’s International Fellowship Initiative (PIFI) of the Chinese Academy of Sciences under grant no.2018PM0017 and by the Strategic Priority Research Program of the Chinese Academy of Science “Multi-waveband Gravitational Wave Universe” (Grant No. XDB23040000).
Appendix A The Illustris simulation
Among all the galaxies in the local Universe, only one third are found in ellipticals (Conselice et al. 2016) with ages spanning the range 1−10 Gyr (Gallazzi et al. 2006), a feature that is represented reasonably well in the latest generation of cosmological simulations, such as the Illustris simulation (Vogelsberger et al. 2014b; Snyder et al. 2015). Recently, however, it has been argued that the latter overproduces disc galaxies with stellar masses in the range 1010 −1011 M⊙ (Bottrell et al. 2017).
There is some evidence that the stellar mass in low-star-formation-rate galaxies is ~ 52% of the total stellar mass in galaxies (Moustakas et al. 2013; Vogelsberger et al. 2014a). If we assume that ellipticals dominate the population of galaxies with little or no star formation, then our adopted estimate of stellar mass contained in ellipticals (one third) may change to one half. This would slightly (by a factor of 1.5) increase all the NS-NS merger rates calculated in our study. However, such a change has no influence on our conclusions.
We take advantage of the Illustris-1 simulation which modeled the evolution of a cosmological cube with side L =106.5 Mpc using 1.8 × 10¹⁰ particles for representing baryonic and dark matter and full physics prescriptions as described in Vogelsberger et al. (2014b).
We calculated the total number of objects with a stellar mass above 106 M⊙ at redshift z = 0, in order to take into account all the bounded stellar systems available in the simulation. This led to a total number of objects NIll = 238 525 with total stellar mass MIll = 3.9 × 10¹⁴ M⊙.
Subsequently, we rescaled the total number and stellar mass of all the elliptical galaxies (1∕3 of the total) contained within 100 Mpc3, scaling the quantities above as:

References
- Abbott, B. P., Abbott, R., Abbott, T. D., et al. 2017, Phys. Rev. Lett., 119, 161101 [NASA ADS] [CrossRef] [PubMed] [Google Scholar]
- Antonini, F. 2013, ApJ, 763, 62 [NASA ADS] [CrossRef] [Google Scholar]
- Antonini, F., & Perets, H. B. 2012, ApJ, 757, 27 [NASA ADS] [CrossRef] [Google Scholar]
- Antonini, F., & Rasio, F. A. 2016, ApJ, 831, 187 [NASA ADS] [CrossRef] [Google Scholar]
- Antonini, F., Barausse, E., & Silk, J. 2015, ApJ, 812, 72 [NASA ADS] [CrossRef] [Google Scholar]
- Arca-Sedda, M., & Capuzzo-Dolcetta, R. 2014a, ApJ, 785, 51 [NASA ADS] [CrossRef] [Google Scholar]
- Arca-Sedda, M., & Capuzzo-Dolcetta, R. 2014b, MNRAS, 444, 3738 [NASA ADS] [CrossRef] [Google Scholar]
- Arca-Sedda, M., & Capuzzo-Dolcetta, R. 2016, MNRAS, 461, 4335 [NASA ADS] [CrossRef] [Google Scholar]
- Arca-Sedda, M., & Capuzzo-Dolcetta, R. 2017a, MNRAS, 464, 3060 [NASA ADS] [CrossRef] [Google Scholar]
- Arca-Sedda, M., & Capuzzo-Dolcetta, R. 2017b, MNRAS, 471, 478 [NASA ADS] [CrossRef] [Google Scholar]
- Arca-Sedda, M., & Capuzzo-Dolcetta, R. 2017c, MNRAS, submitted [arXiv:1709.05567] [Google Scholar]
- Arca-Sedda, M., Capuzzo-Dolcetta, R., Antonini, F., & Seth, A. 2015, ApJ, 806, 220 [NASA ADS] [CrossRef] [Google Scholar]
- Arca-Sedda, M., Capuzzo-Dolcetta, R., & Spera, M. 2016, MNRAS, 456, 2457 [NASA ADS] [CrossRef] [Google Scholar]
- Arca-Sedda, M., Kocsis, B., & Brandt, T. 2018a, MNRAS, 479, 900 [NASA ADS] [CrossRef] [Google Scholar]
- Arca-Sedda, M., Askar, A., & Giersz, M. 2018b, MNRAS, submitted [arXiv:1801.00795] [Google Scholar]
- Askar, A., Szkudlarek, M., Gondek-Rosińska, D., Giersz, M., & Bulik, T. 2017, MNRAS, 464, L36 [NASA ADS] [CrossRef] [Google Scholar]
- Askar, A., Arca-Sedda, M., & Giersz, M. 2018, MNRAS, 478, 1844 [NASA ADS] [CrossRef] [Google Scholar]
- Bastian, N., Covey, K. R., & Meyer, M. R. 2010, ARA&A, 48, 339 [NASA ADS] [CrossRef] [Google Scholar]
- Baumgardt, H., Amaro-Seoane, P., & Schödel, R. 2018, A&A, 609, A28 [NASA ADS] [CrossRef] [EDP Sciences] [Google Scholar]
- Bekki, K. 2007, PASA, 24, 77 [NASA ADS] [CrossRef] [Google Scholar]
- Belczynski, K., & Taam, R. E. 2008, ApJ, 685, 400 [NASA ADS] [CrossRef] [Google Scholar]
- Belczynski, K., Kalogera, V., & Bulik, T. 2002, ApJ, 572, 407 [NASA ADS] [CrossRef] [Google Scholar]
- Belczynski, K., Taam, R. E., Kalogera, V., Rasio, F. A., & Bulik, T. 2007, ApJ, 662, 504 [NASA ADS] [CrossRef] [Google Scholar]
- Belczynski, K., Kalogera, V., Rasio, F. A., et al. 2008, ApJS, 174, 223 [NASA ADS] [CrossRef] [Google Scholar]
- Belczynski, K., Wiktorowicz, G., Fryer, C. L., Holz, D. E., & Kalogera, V. 2012, ApJ, 757, 91 [NASA ADS] [CrossRef] [Google Scholar]
- Belczynski, K., Holz, D. E., Bulik, T., & O’Shaughnessy, R. 2016, Nature, 534, 512 [NASA ADS] [CrossRef] [Google Scholar]
- Belczynski, K., Klencki, J., Meynet, G., et al. 2017, MNRAS, submitted [arXiv:1706.07053] [Google Scholar]
- Belloni, D., Askar, A., Giersz, M., Kroupa, P., & Rocha-Pinto, H. J. 2017a, MNRAS, 471, 2812 [NASA ADS] [CrossRef] [Google Scholar]
- Belloni, D., Zorotovic, M., Schreiber, M. R., et al. 2017b, MNRAS, 468, 2429 [NASA ADS] [CrossRef] [Google Scholar]
- Belloni, D., Schreiber, M., Zorotovic, M., et al. 2018, MNRAS, 478, 5639 [NASA ADS] [CrossRef] [Google Scholar]
- Blanchard, P. K., Berger, E., Fong, W., et al. 2017, ApJ, 848, 22 [Google Scholar]
- Bottrell, C., Torrey, P., Simard, L., & Ellison, S. L. 2017, MNRAS, 467, 2879 [NASA ADS] [CrossRef] [Google Scholar]
- Breen, P. G., & Heggie, D. C. 2013a, MNRAS, 432, 2779 [NASA ADS] [CrossRef] [Google Scholar]
- Breen, P. G., & Heggie, D. C. 2013b, MNRAS, 436, 584 [NASA ADS] [CrossRef] [Google Scholar]
- Capuzzo-Dolcetta, R. 1993, ApJ, 415, 616 [NASA ADS] [CrossRef] [Google Scholar]
- Capuzzo-Dolcetta, R., & Tosta e Melo, I. 2017, MNRAS, 472, 4013 [NASA ADS] [CrossRef] [Google Scholar]
- Chruslinska, M., Belczynski, K., Bulik, T., & Gladysz, W. 2017, Acta Astron., 67, 37 [NASA ADS] [Google Scholar]
- Chruslinska, M., Belczynski, K., Klencki, J., & Benacquista, M. 2018, MNRAS, 474, 2937 [NASA ADS] [CrossRef] [Google Scholar]
- Conselice, C. J., Wilkinson, A., Duncan, K., & Mortlock, A. 2016, ApJ, 830, 83 [Google Scholar]
- Côté, P., Piatek, S., Ferrarese, L., et al. 2006, ApJS, 165, 57 [NASA ADS] [CrossRef] [MathSciNet] [Google Scholar]
- Côté, B., Fryer, C. L., Belczynski, K., et al. 2018, ApJ, 855, 99 [NASA ADS] [CrossRef] [Google Scholar]
- de Mink, S. E., & Mandel, I. 2016, MNRAS, 460, 3545 [NASA ADS] [CrossRef] [Google Scholar]
- de Mink, S. E., Cantiello, M., Langer, N., et al. 2009, A&A, 497, 243 [NASA ADS] [CrossRef] [EDP Sciences] [Google Scholar]
- Dehnen, W. 1993, MNRAS, 265, 250 [NASA ADS] [CrossRef] [Google Scholar]
- Dessart, L., Burrows, A., Ott, C. D., et al. 2006, ApJ, 644, 1063 [NASA ADS] [CrossRef] [Google Scholar]
- Dominik, M., Belczynski, K., Fryer, C., et al. 2012, ApJ, 759, 52 [NASA ADS] [CrossRef] [Google Scholar]
- Ebrová, I. & Bílek, M. 2018, ArXiv e-prints [arXiv:1801.01493] [Google Scholar]
- Eldridge, J. J., & Stanway, E. R. 2016, MNRAS, 462, 3302 [NASA ADS] [CrossRef] [Google Scholar]
- Ferrarese, L., Côté, P., Dalla Bontà, E., et al. 2006, ApJ, 644, L21 [NASA ADS] [CrossRef] [Google Scholar]
- Fregeau, J. M., Cheung, P., Portegies Zwart, S. F., & Rasio, F. A. 2004, MNRAS, 352, 1 [NASA ADS] [CrossRef] [Google Scholar]
- Fryer, C. L., & Kusenko, A. 2006, ApJS, 163, 335 [NASA ADS] [CrossRef] [Google Scholar]
- Fryer, C. L., Belczynski, K., Wiktorowicz, G., et al. 2012, ApJ, 749, 91 [NASA ADS] [CrossRef] [Google Scholar]
- Gallazzi, A., Charlot, S., Brinchmann, J., & White, S. D. M. 2006, MNRAS, 370, 1106 [NASA ADS] [CrossRef] [Google Scholar]
- Genel, S., Vogelsberger, M., Springel, V., et al. 2014, MNRAS, 445, 175 [Google Scholar]
- Georgiev, I. Y., Böker, T., Leigh, N., Lützgendorf, N., & Neumayer, N. 2016, MNRAS, 457, 2122 [Google Scholar]
- Giersz, M. 1998, MNRAS, 298, 1239 [NASA ADS] [CrossRef] [Google Scholar]
- Giersz, M., Heggie, D. C., Hurley, J. R., & Hypki, A. 2013, MNRAS, 431, 2184 [NASA ADS] [CrossRef] [Google Scholar]
- Giersz, M., Leigh, N., Hypki, A., Lützgendorf, N., & Askar, A. 2015, MNRAS, 454, 3150 [NASA ADS] [CrossRef] [Google Scholar]
- Gnedin, O. Y., Ostriker, J. P., & Tremaine, S. 2014, ApJ, 785, 71 [NASA ADS] [CrossRef] [Google Scholar]
- Graham, A. W. 2012, MNRAS, 422, 1586 [NASA ADS] [CrossRef] [Google Scholar]
- Hamann, W.-R., & Koesterke, L. 1998, A&A, 335, 1003 [NASA ADS] [Google Scholar]
- Harris, W. E., Morningstar, W., Gnedin, O. Y., et al. 2014, ApJ, 797, 128 [NASA ADS] [CrossRef] [Google Scholar]
- Harris, W. E., Harris, G. L., & Hudson, M. J. 2015, ApJ, 806, 36 [NASA ADS] [CrossRef] [Google Scholar]
- Heggie, D. C.,& Giersz, M. 2014, MNRAS, 439, 2459 [NASA ADS] [CrossRef] [Google Scholar]
- Hénon, M. H. 1971, Ap&SS, 14, 151 [NASA ADS] [CrossRef] [Google Scholar]
- Hoang, B.-M., Naoz, S., Kocsis, B., Rasio, F. A., & Dosopoulou, F. 2017, ApJ, 856, 140 [Google Scholar]
- Hobbs, G., Lorimer, D. R., Lyne, A. G., & Kramer, M. 2005, MNRAS, 360, 974 [NASA ADS] [CrossRef] [Google Scholar]
- Hurley, J. R., Pols, O. R., & Tout, C. A. 2000, MNRAS, 315, 543 [NASA ADS] [CrossRef] [Google Scholar]
- Hurley, J. R., Tout, C. A., & Pols, O. R. 2002, MNRAS, 329, 897 [NASA ADS] [CrossRef] [Google Scholar]
- Hypki, A., & Giersz, M. 2013, MNRAS, 429, 1221 [NASA ADS] [CrossRef] [Google Scholar]
- Janka, H.-T., & Mueller, E. 1994, A&A, 290, 496 [NASA ADS] [Google Scholar]
- Jones, S., Hirschi, R., Nomoto, K., et al. 2013, ApJ, 772, 150 [NASA ADS] [CrossRef] [Google Scholar]
- King, A. 2003, ApJ, 596, L27 [NASA ADS] [CrossRef] [Google Scholar]
- King, I. R. 1966, AJ, 71, 64 [Google Scholar]
- Kobulnicky, H. A., Kiminki, D. C., Lundquist, M. J., et al. 2014, ApJS, 213, 34 [NASA ADS] [CrossRef] [Google Scholar]
- Kroupa, P. 1995, MNRAS, 277, 1507 [NASA ADS] [Google Scholar]
- Kroupa, P. 2001, MNRAS, 322, 231 [NASA ADS] [CrossRef] [Google Scholar]
- Kruckow, M. U., Tauris, T. M., Langer, N., Kramer, M., & Izzard, R. G. 2018, MNRAS, submitted [arXiv:1801.05433] [Google Scholar]
- Lamers, H. J. G. L. M., Baumgardt, H., & Gieles, M. 2010, MNRAS, 409, 305 [NASA ADS] [CrossRef] [Google Scholar]
- Leigh, N., Böker, T., & Knigge, C. 2012, MNRAS, 424, 2130 [NASA ADS] [CrossRef] [Google Scholar]
- Lipunov, V. M., Postnov, K. A., & Prokhorov, M. E. 1997, Astron. Lett., 23, 492 [NASA ADS] [Google Scholar]
- Lyutikov, M., & Toonen, S. 2017, MNRAS, submitted [arXiv:1709.02221] [Google Scholar]
- MacLeod, M., Antoni, A., Murguia-Berthier, A., Macias, P., & Ramirez-Ruiz, E. 2017, ApJ, 838, 56 [NASA ADS] [CrossRef] [Google Scholar]
- Maeder, A. 1987, A&A, 178, 159 [NASA ADS] [Google Scholar]
- Mandel, I., & de Mink S. E. 2016, MNRAS, 458, 2634 [NASA ADS] [CrossRef] [Google Scholar]
- Marchant, P., Langer, N., Podsiadlowski, P., Tauris, T. M., & Moriya, T. J. 2016, A&A, 588, A50 [NASA ADS] [CrossRef] [EDP Sciences] [Google Scholar]
- Miyaji, S., Nomoto, K., Yokoi, K., & Sugimoto, D. 1980, PASJ, 32, 303 [Google Scholar]
- Moriya, T. J. 2016, ApJ, 830, L38 [NASA ADS] [CrossRef] [Google Scholar]
- Morscher, M., Umbreit, S., Farr, W. M., & Rasio, F. A. 2013, ApJ, 763, L15 [NASA ADS] [CrossRef] [Google Scholar]
- Morscher, M., Pattabiraman, B., Rodriguez, C., Rasio, F. A., & Umbreit, S. 2015, ApJ, 800, 9 [NASA ADS] [CrossRef] [Google Scholar]
- Moustakas, J., Coil, A. L., Aird, J., et al. 2013, ApJ, 767, 50 [NASA ADS] [CrossRef] [Google Scholar]
- Nayakshin, S., Wilkinson, M. I., & King, A. 2009, MNRAS, 398, L54 [NASA ADS] [CrossRef] [Google Scholar]
- Neumayer, N.,& Walcher, C. J. 2012, Adv. Astron., 2012, 709038 [NASA ADS] [Google Scholar]
- Palmese, A., Hartley, W., Tarsitano, F., et al. 2017, ApJ, 849, L34 [NASA ADS] [CrossRef] [Google Scholar]
- Park, D., Kim, C., Lee, H. M., Bae, Y.-B., & Belczynski, K. 2017, MNRAS, 469, 4665 [NASA ADS] [CrossRef] [Google Scholar]
- Pavlovskii, K.,& Ivanova, N. 2015, MNRAS, 449, 4415 [NASA ADS] [CrossRef] [Google Scholar]
- Peters, P. C. 1964, Phys. Rev., 136, 1224 [Google Scholar]
- Petts, J. A., Gualandris, A., & Read, J. I. 2015, MNRAS, 454, 3778 [NASA ADS] [CrossRef] [Google Scholar]
- Petts, J. A., Read, J. I., & Gualandris, A. 2016, MNRAS, 463, 858 [NASA ADS] [CrossRef] [Google Scholar]
- Peuten, M., Zocchi, A., Gieles, M., Gualandris, A., & Hénault-Brunet, V. 2016, MNRAS, 462, 2333 [NASA ADS] [CrossRef] [Google Scholar]
- Podsiadlowski, P., Langer, N., Poelarends, A. J. T., et al. 2004, ApJ, 612, 1044 [NASA ADS] [CrossRef] [Google Scholar]
- Portegies Zwart, S. F., Baumgardt, H., Hut, P., Makino, J., & McMillan, S. L. W. 2004, Nature, 428, 724 [NASA ADS] [CrossRef] [PubMed] [Google Scholar]
- Rodriguez, C. L., Morscher, M., Pattabiraman, B., et al. 2015, Phys. Rev. Lett., 115, 051101 [NASA ADS] [CrossRef] [Google Scholar]
- Rodriguez, C. L., Chatterjee, S., & Rasio, F. A. 2016a, Phys. Rev. D, 93, 084029 [NASA ADS] [CrossRef] [Google Scholar]
- Rodriguez, C. L., Haster, C.-J., Chatterjee, S., Kalogera, V., & Rasio, F. A. 2016b, ApJ, 824, L8 [NASA ADS] [CrossRef] [Google Scholar]
- Rodriguez, C. L., Morscher, M., Wang, L., et al. 2016c, MNRAS, 463, 2109 [NASA ADS] [CrossRef] [Google Scholar]
- Rodriguez, C. L., Zevin, M., Pankow, C., Kalogera, V., & Rasio, F. A. 2016d, ApJ, 832, L2 [NASA ADS] [CrossRef] [Google Scholar]
- Rossa, J., van der Marel, R. P., Böker, T., et al. 2006, AJ, 132, 1074 [NASA ADS] [CrossRef] [Google Scholar]
- Sana, H., de Mink, S. E., de Koter, A., et al. 2012, Science, 337, 444 [Google Scholar]
- Schechter, P. 1976, ApJ, 203, 297 [Google Scholar]
- Schwab, J., Quataert, E., & Bildsten, L. 2015, MNRAS, 453, 1910 [NASA ADS] [CrossRef] [Google Scholar]
- Scott, N., & Graham, A. W. 2013, ApJ, 763, 76 [NASA ADS] [CrossRef] [Google Scholar]
- Sippel, A. C., & Hurley, J. R. 2013, MNRAS, 430, L30 [NASA ADS] [Google Scholar]
- Snyder, G. F., Torrey, P., Lotz, J. M., et al. 2015, MNRAS, 454, 1886 [NASA ADS] [CrossRef] [Google Scholar]
- Stevenson, S., Vigna-Gómez, A., Mandel, I., et al. 2017, Nat. Commun., 8, 14906 [NASA ADS] [CrossRef] [Google Scholar]
- Stodolkiewicz, J. S. 1986, Acta Astron., 36, 19 [NASA ADS] [Google Scholar]
- Torrey, P., Wellons, S., Machado, F., et al. 2015, MNRAS, 454, 2770 [NASA ADS] [CrossRef] [Google Scholar]
- Tremaine, S. D., Ostriker, J. P., & Spitzer, Jr. L. 1975, ApJ, 196, 407 [NASA ADS] [CrossRef] [Google Scholar]
- Troja, E., Piro, L., van Eerten, H., et al. 2017, Nature, 551, 71 [NASA ADS] [CrossRef] [Google Scholar]
- Tsatsi, A., Mastrobuono-Battisti, A., van de Ven, G., et al. 2017, MNRAS, 464, 3720 [NASA ADS] [CrossRef] [Google Scholar]
- Turner, M. L., Côté, P., Ferrarese, L., et al. 2012, ApJS, 203, 5 [NASA ADS] [CrossRef] [Google Scholar]
- Tutukov, A. V., & Yungelson, L. R. 1993, MNRAS, 260, 675 [NASA ADS] [CrossRef] [Google Scholar]
- Vink, J. S., & de Koter A. 2005, A&A, 442, 587 [NASA ADS] [CrossRef] [EDP Sciences] [Google Scholar]
- Vink, J. S., de Koter, A., & Lamers, H. J. G. L. M. 2001, A&A, 369, 574 [NASA ADS] [CrossRef] [EDP Sciences] [Google Scholar]
- Vogelsberger, M., Genel, S., Springel, V., et al. 2014a, Nature, 509, 177 [NASA ADS] [CrossRef] [Google Scholar]
- Vogelsberger, M., Genel, S., Springel, V., et al. 2014b, MNRAS, 444, 1518 [NASA ADS] [CrossRef] [Google Scholar]
- Voss, R., & Tauris, T. M. 2003, MNRAS, 342, 1169 [NASA ADS] [CrossRef] [Google Scholar]
- Wang, L., Spurzem, R., Aarseth, S., et al. 2016, MNRAS, 458, 1450 [NASA ADS] [CrossRef] [Google Scholar]
- Webb, J. J., & Leigh, N. W. C. 2015, MNRAS, 453, 3278 [NASA ADS] [CrossRef] [Google Scholar]
- Webbink, R. F. 1984, ApJ, 277, 355 [NASA ADS] [CrossRef] [Google Scholar]
- Woosley, S. E. 2016, ApJ, 824, L10 [NASA ADS] [CrossRef] [Google Scholar]
- Xu, X.-J., & Li, X.-D. 2010, ApJ, 722, 1985 [NASA ADS] [CrossRef] [Google Scholar]
- Yoon, S.-C., & Langer, N. 2005, A&A, 443, 643 [NASA ADS] [CrossRef] [EDP Sciences] [Google Scholar]
- Yoon, S.-C., Langer, N., & Norman, C. 2006, A&A, 460, 199 [NASA ADS] [CrossRef] [EDP Sciences] [Google Scholar]
A short summary of few of these updates is available at ftp://ftp.ast.cam.ac.uk/pub/sverre/nbody6/README_SSE
However we note that the optimistic model adopted here tends to overestimate rates of Galactic NS-NS systems, while being consistent with short Gamma-ray burst rates; see Chruslinska et al. (2018, Figs. 6 and 7: model J5 submodel B).
All Tables
All Figures
|
Fig. 1 Example of the formation of an NS-NS merger similar to GW170817 in the classical isolated binary evolution channel. |
| In the text | |
|
Fig. 2 Initial orbital separation of binaries that are progenitors of NS-NS mergers; we note that the distribution is close to a−1 (top). After binary evolution (mass transfers, supernovae, CE) close NS-NS systems form with much smaller orbital separations, and their orbital separation distribution may be approximated by a steep power-law: a−3 (bottom). |
| In the text | |
|
Fig. 3 Example of the formation of an NS-NS merger similar to GW170817 in the globular cluster dynamical channel. |
| In the text | |
|
Fig. 4 Correlation between initial mass of GCs and the estimated number of NS-NS binaries such a cluster could produce. The error bars represent the Poisson error in the number of NS-NS mergers that form in GCs with a given initial mass. |
| In the text | |
|
Fig. 5 The normalized cumulative distribution of NS-NS merger delay time (from star formation to the merger) for classical isolated binary evolution and globular cluster formation channels. The isolated binary calculations formed 52 182 NS-NS mergers and there were 34 NS-NS mergers in GC simulations. |
| In the text | |
|
Fig. 6 Example of the formation of an NS-NS merger similar to GW170817 in a nuclear cluster. |
| In the text | |
|
Fig. 7 GC mass distribution in one of the smallest (Mg ~ 3.2 × 10⁸ M⊙, gray boxes) and largest (Mg = 5 × 10¹¹ M⊙, red boxes) galaxy models. |
| In the text | |
|
Fig. 8 NC mass normalized to the total GCs mass, as a function of the stellar galaxy mass. The color-coded map shows the mean mass of GCs that contributed to the NC assembly. |
| In the text | |
Current usage metrics show cumulative count of Article Views (full-text article views including HTML views, PDF and ePub downloads, according to the available data) and Abstracts Views on Vision4Press platform.
Data correspond to usage on the plateform after 2015. The current usage metrics is available 48-96 hours after online publication and is updated daily on week days.
Initial download of the metrics may take a while.